Capital One 2012 Annual Report Download - page 86
Download and view the complete annual report
Please find page 86 of the 2012 Capital One annual report below. You can navigate through the pages in the report by either clicking on the pages listed below, or by using the keyword search tool below to find specific information within the annual report.-
 1
1 -
2
-
3
-
4
-
5
-
6
-
7
-
8
-
9
-
10
-
11
-
12
-
13
-
14
-
15
-
16
-
17
-
18
-
19
-
20
-
21
-
22
-
23
-
24
-
25
-
26
-
27
-
28
-
29
-
30
-
31
-
32
-
33
-
34
-
35
-
36
-
37
-
38
-
39
-
40
-
41
-
42
-
43
-
44
-
45
-
46
-
47
-
48
-
49
-
50
-
51
-
52
-
53
-
54
-
55
-
56
-
57
-
58
-
59
-
60
-
61
-
62
-
63
-
64
-
65
-
66
-
67
-
68
-
69
-
70
-
71
-
72
-
73
-
74
-
75
-
 76
76 -
 77
77 -
 78
78 -
 79
79 -
 80
80 -
 81
81 -
 82
82 -
 83
83 -
 84
84 -
 85
85 -
 86
86 -
 87
87 -
 88
88 -
 89
89 -
 90
90 -
 91
91 -
 92
92 -
 93
93 -
 94
94 -
 95
95 -
 96
96 -
97
-
98
-
99
-
100
-
101
-
102
-
103
-
104
-
105
-
106
-
107
-
108
-
109
-
110
-
111
-
112
-
113
-
114
-
115
-
116
-
117
-
118
-
119
-
120
-
121
-
122
-
123
-
124
-
125
-
126
-
127
-
128
-
129
-
130
-
131
-
132
-
133
-
134
-
135
-
136
-
137
-
138
-
139
-
140
-
141
-
142
-
143
-
144
-
145
-
146
-
147
-
148
-
149
-
150
-
151
-
152
-
153
-
154
-
155
-
156
-
157
-
158
-
159
-
160
-
161
-
162
-
163
-
164
-
165
-
166
-
167
-
168
-
169
-
170
-
171
-
172
-
173
-
174
-
175
-
176
-
177
-
178
-
179
-
180
-
181
-
182
-
183
-
184
-
185
-
186
-
187
-
188
-
189
-
190
-
191
-
192
-
193
-
194
-
195
-
196
-
197
-
198
-
199
-
200
-
201
-
202
-
203
-
204
-
205
-
206
-
207
-
208
-
209
-
210
-
211
-
212
-
213
-
214
-
215
-
216
-
217
-
218
-
219
-
220
-
221
-
222
-
223
-
224
-
225
-
226
-
227
-
228
-
229
-
230
-
231
-
232
-
233
-
234
-
235
-
236
-
237
-
238
-
239
-
240
-
241
-
242
-
243
-
244
-
245
-
246
-
247
-
248
-
249
-
250
-
251
-
252
-
253
-
254
-
255
-
256
-
257
-
258
-
259
-
260
-
261
-
262
-
263
-
264
-
265
-
266
-
267
-
268
-
269
-
270
-
271
-
272
-
273
-
274
-
275
-
276
-
277
-
278
-
279
-
280
-
281
-
282
-
283
-
284
-
285
-
286
-
287
-
288
-
289
-
290
-
291
-
292
-
293
-
294
-
295
-
296
-
297
-
298
-
299
-
300
-
301
-
302
-
303
-
304
-
305
-
306
-
307
-
308
-
309
-
310
-
311
 |
 |

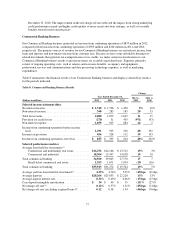
offer private-label-credit cards, a substantial majority of which are not for general use and are limited to the
products and services sold by the private-label partner. We provide information on the accounting for
acquisitions and partnership agreements in “Note 1—Summary of Significant Accounting Policies.”
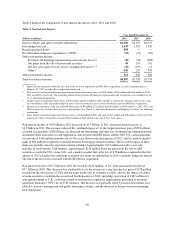
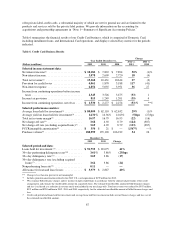
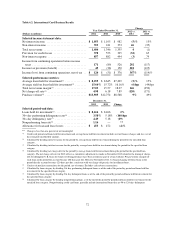
Table 6 summarizes the financial results of our Credit Card business, which is comprised of Domestic Card,
including installment loans, and International Card operations, and displays selected key metrics for the periods
indicated.
Table 6: Credit Card Business Results
(Dollars in millions)
Year Ended December 31,
Change
2012 vs.
2011
2011 vs.
20102012 2011 2010
Selected income statement data:
Net interest income(1) ....................... $ 10,182 $ 7,822 $ 7,894 30% (1)%
Non-interest income ......................... 3,078 2,609 2,720 18 (4)
Total net revenue(2) ......................... 13,260 10,431 10,614 27 (2)
Provision for credit losses .................... 4,061 1,870 3,188 117 (41)
Non-interest expense ........................ 6,854 5,035 3,951 36 27
Income from continuing operations before income
taxes ................................... 2,345 3,526 3,475 (33) 1
Income tax provision ........................ 815 1,249 1,201 (35) 4
Income from continuing operations, net of tax .... $ 1,530 $ 2,277 $ 2,274 (33)% **%
Selected performance metrics:
Average loans held for investment(3) ............ $ 80,009 $ 62,110 $ 62,632 29% (1)%
Average yield on loans held for investment(4) ..... 14.31% 14.36% 14.63% (5)bps (27)bps
Total net revenue margin(5) ................... 16.57 16.79 16.95 (22) (16)
Net charge-off rate(6) ........................ 3.68 4.92 8.79 (124) (387)
Net charge-off rate (excluding acquired loans)(7) .. 3.69 4.92 8.79 (123) (387)
PCCR intangible amortization(8) ............... $ 350 $21$—1,567% —%
Purchase volume(9) .......................... 180,599 135,120 106,912 34 26
December 31,
2012 2011 Change
Selected period-end data:
Loans held for investment:(3) .................. $ 91,755 $ 65,075 41%
30+ day performing delinquency rate(10) ......... 3.61% 3.86% (25)bps
30+ day delinquency rate(11) ................... 3.69 3.86 (17)
30+ day delinquency rate (excluding acquired
loans)(7) ................................. 3.62 3.86 (24)
Nonperforming loan rate(12) ................... 0.11 ——
Allowance for loan and lease losses ............ $ 3,979 $ 2,847 40%
** Change is less than one percent or not meaningful.
(1) Includes premium amortization related to the 2012 U.S. card acquisition of $159 million for 2012.
(2) We recognize billed finance charges and fee income on open-ended loans in accordance with the contractual provisions of the credit
arrangements and estimate the uncollectible amount on a quarterly basis. The estimated uncollectible amount of billed finance charges
and fees is reflected as a reduction in revenue and is not included in our net charge-offs. Total net revenue was reduced by $937 million,
$371 million and $950 million in 2012, 2011 and 2010, respectively, for the estimated uncollectible amount of billed finance charges and
fees.
(3) Credit card period-end loans held for investment and average loans held for investment include accrued finance charges and fees, net of
the estimated uncollectible amount.
67