Capital One 2012 Annual Report Download - page 190
Download and view the complete annual report
Please find page 190 of the 2012 Capital One annual report below. You can navigate through the pages in the report by either clicking on the pages listed below, or by using the keyword search tool below to find specific information within the annual report.-
 1
1 -
2
-
3
-
4
-
5
-
6
-
7
-
8
-
9
-
10
-
11
-
12
-
13
-
14
-
15
-
16
-
17
-
18
-
19
-
20
-
21
-
22
-
23
-
24
-
25
-
26
-
27
-
28
-
29
-
30
-
31
-
32
-
33
-
34
-
35
-
36
-
37
-
38
-
39
-
40
-
41
-
42
-
43
-
44
-
45
-
46
-
47
-
48
-
49
-
50
-
51
-
52
-
53
-
54
-
55
-
56
-
57
-
58
-
59
-
60
-
61
-
62
-
63
-
64
-
65
-
66
-
67
-
68
-
69
-
70
-
71
-
72
-
73
-
74
-
75
-
76
-
77
-
78
-
79
-
80
-
81
-
82
-
83
-
84
-
85
-
86
-
87
-
88
-
89
-
90
-
91
-
92
-
93
-
94
-
95
-
96
-
97
-
98
-
99
-
100
-
101
-
102
-
103
-
104
-
105
-
106
-
107
-
108
-
109
-
110
-
111
-
112
-
113
-
114
-
115
-
116
-
117
-
118
-
119
-
120
-
121
-
122
-
123
-
124
-
125
-
126
-
127
-
128
-
129
-
130
-
131
-
132
-
133
-
134
-
135
-
136
-
137
-
138
-
139
-
140
-
141
-
142
-
143
-
144
-
145
-
146
-
147
-
148
-
149
-
150
-
151
-
152
-
153
-
154
-
155
-
156
-
157
-
158
-
159
-
160
-
161
-
162
-
163
-
164
-
165
-
166
-
167
-
168
-
169
-
170
-
171
-
172
-
173
-
174
-
175
-
176
-
177
-
178
-
179
-
 180
180 -
 181
181 -
 182
182 -
 183
183 -
 184
184 -
 185
185 -
 186
186 -
 187
187 -
 188
188 -
 189
189 -
 190
190 -
 191
191 -
 192
192 -
 193
193 -
 194
194 -
 195
195 -
 196
196 -
 197
197 -
 198
198 -
 199
199 -
 200
200 -
201
-
202
-
203
-
204
-
205
-
206
-
207
-
208
-
209
-
210
-
211
-
212
-
213
-
214
-
215
-
216
-
217
-
218
-
219
-
220
-
221
-
222
-
223
-
224
-
225
-
226
-
227
-
228
-
229
-
230
-
231
-
232
-
233
-
234
-
235
-
236
-
237
-
238
-
239
-
240
-
241
-
242
-
243
-
244
-
245
-
246
-
247
-
248
-
249
-
250
-
251
-
252
-
253
-
254
-
255
-
256
-
257
-
258
-
259
-
260
-
261
-
262
-
263
-
264
-
265
-
266
-
267
-
268
-
269
-
270
-
271
-
272
-
273
-
274
-
275
-
276
-
277
-
278
-
279
-
280
-
281
-
282
-
283
-
284
-
285
-
286
-
287
-
288
-
289
-
290
-
291
-
292
-
293
-
294
-
295
-
296
-
297
-
298
-
299
-
300
-
301
-
302
-
303
-
304
-
305
-
306
-
307
-
308
-
309
-
310
-
311
 |
 |

CAPITAL ONE FINANCIAL CORPORATION
NOTES TO CONSOLIDATED FINANCIAL STATEMENTS—(Continued)
Year Ended
December 31, 2010
(Dollars in millions)
Before
Tax Tax
After
Tax
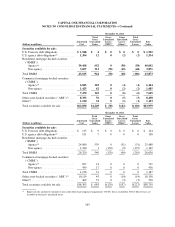
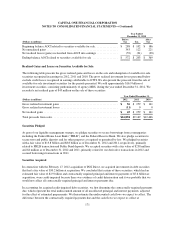
Beginning balance AOCI related to securities available for sale ................ $ 288 $ 102 $ 186
Net unrealized gains .................................................. 343 122 221
Net realized losses (gains) reclassified from AOCI into earnings ............... (59) (21) (38)
Ending balance AOCI related to securities available for sale .................. $ 572 $ 203 $ 369
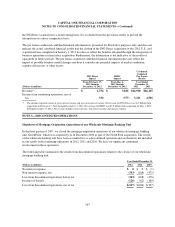
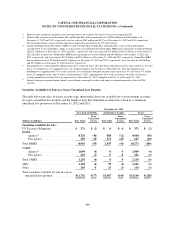
Realized Gains and Losses on Securities Available for Sale
The following table presents the gross realized gains and losses on the sale and redemption of available-for-sale
securities recognized in earnings in 2012, 2011 and 2010. The gross realized investment losses presented below
exclude credit losses recognized in earnings attributable to OTTI. We also present the proceeds from the sale of
available-for-sale investment securities for the periods presented. We sold approximately $16.9 billion of
investment securities, consisting predominantly of agency MBS, during the year ended December 31, 2012. We
recorded a net realized gain of $45 million on the sale of these securities.
Year Ended December 31,
(Dollars in millions) 2012 2011 2010
Gross realized investment gains ......................................... $ 56 $ 259 $ 141
Gross realized investment losses ........................................ (11) 00
Net realized gains .................................................... $ 45 $ 259 $ 141
Total proceeds from sales .............................................. $16,894 $9,169 $12,466
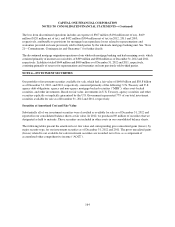
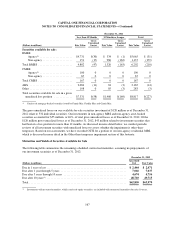
Securities Pledged
As part of our liquidity management strategy, we pledge securities to secure borrowings from counterparties
including the Federal Home Loan Bank (“FHLB”) and the Federal Reserve Bank. We also pledge securities to
secure trust and public deposits and for other purposes as required or permitted by law. We pledged securities
with a fair value of $13.8 billion and $8.8 billion as of December 31, 2012 and 2011, respectively, primarily
related to FHLB transaction and Public Fund deposits. We accepted securities with a fair value of $238 million
and $4 million as of December 31, 2012 and 2011, primarily related to our derivative transactions in 2012 and
secured borrowings transactions in 2011.
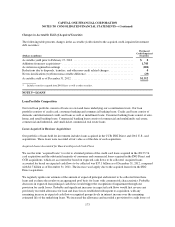
Securities Acquired
In connection with the February 17, 2012 acquisition of ING Direct, we acquired investments in debt securities
that had a fair value of $30.2 billion at acquisition. We concluded that certain of these securities, which had an
estimated fair value of $2.9 billion and contractually required principal and interest payments of $5.6 billion at
acquisition, were credit-impaired because there was evidence of credit deterioration and it was probable that we
would not collect all contractually required principal and interest payments due.
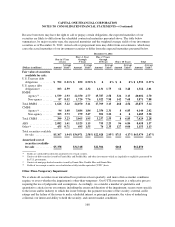
In accounting for acquired credit-impaired debt securities, we first determine the contractually required payments
due, which represent the total undiscounted amount of all uncollected principal and interest payments, adjusted
for the effect of estimated prepayments. We then estimate the undiscounted cash flows we expect to collect. The
difference between the contractually required payments due and the cash flows we expect to collect at
171