Capital One 2012 Annual Report Download - page 153
Download and view the complete annual report
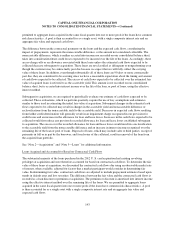
Please find page 153 of the 2012 Capital One annual report below. You can navigate through the pages in the report by either clicking on the pages listed below, or by using the keyword search tool below to find specific information within the annual report.-
 1
1 -
2
-
3
-
4
-
5
-
6
-
7
-
8
-
9
-
10
-
11
-
12
-
13
-
14
-
15
-
16
-
17
-
18
-
19
-
20
-
21
-
22
-
23
-
24
-
25
-
26
-
27
-
28
-
29
-
30
-
31
-
32
-
33
-
34
-
35
-
36
-
37
-
38
-
39
-
40
-
41
-
42
-
43
-
44
-
45
-
46
-
47
-
48
-
49
-
50
-
51
-
52
-
53
-
54
-
55
-
56
-
57
-
58
-
59
-
60
-
61
-
62
-
63
-
64
-
65
-
66
-
67
-
68
-
69
-
70
-
71
-
72
-
73
-
74
-
75
-
76
-
77
-
78
-
79
-
80
-
81
-
82
-
83
-
84
-
85
-
86
-
87
-
88
-
89
-
90
-
91
-
92
-
93
-
94
-
95
-
96
-
97
-
98
-
99
-
100
-
101
-
102
-
103
-
104
-
105
-
106
-
107
-
108
-
109
-
110
-
111
-
112
-
113
-
114
-
115
-
116
-
117
-
118
-
119
-
120
-
121
-
122
-
123
-
124
-
125
-
126
-
127
-
128
-
129
-
130
-
131
-
132
-
133
-
134
-
135
-
136
-
137
-
138
-
139
-
140
-
141
-
142
-
 143
143 -
 144
144 -
 145
145 -
 146
146 -
 147
147 -
 148
148 -
 149
149 -
 150
150 -
 151
151 -
 152
152 -
 153
153 -
 154
154 -
 155
155 -
 156
156 -
 157
157 -
 158
158 -
 159
159 -
 160
160 -
 161
161 -
 162
162 -
 163
163 -
164
-
165
-
166
-
167
-
168
-
169
-
170
-
171
-
172
-
173
-
174
-
175
-
176
-
177
-
178
-
179
-
180
-
181
-
182
-
183
-
184
-
185
-
186
-
187
-
188
-
189
-
190
-
191
-
192
-
193
-
194
-
195
-
196
-
197
-
198
-
199
-
200
-
201
-
202
-
203
-
204
-
205
-
206
-
207
-
208
-
209
-
210
-
211
-
212
-
213
-
214
-
215
-
216
-
217
-
218
-
219
-
220
-
221
-
222
-
223
-
224
-
225
-
226
-
227
-
228
-
229
-
230
-
231
-
232
-
233
-
234
-
235
-
236
-
237
-
238
-
239
-
240
-
241
-
242
-
243
-
244
-
245
-
246
-
247
-
248
-
249
-
250
-
251
-
252
-
253
-
254
-
255
-
256
-
257
-
258
-
259
-
260
-
261
-
262
-
263
-
264
-
265
-
266
-
267
-
268
-
269
-
270
-
271
-
272
-
273
-
274
-
275
-
276
-
277
-
278
-
279
-
280
-
281
-
282
-
283
-
284
-
285
-
286
-
287
-
288
-
289
-
290
-
291
-
292
-
293
-
294
-
295
-
296
-
297
-
298
-
299
-
300
-
301
-
302
-
303
-
304
-
305
-
306
-
307
-
308
-
309
-
310
-
311
 |
 |

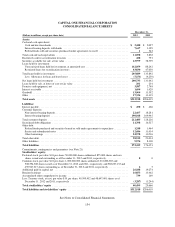
CAPITAL ONE FINANCIAL CORPORATION
CONSOLIDATED BALANCE SHEETS
December 31,
(Dollars in millions, except per share data) 2012 2011
Assets:
Cash and cash equivalents:
Cash and due from banks ........................................................... $ 3,440 $ 2,097
Interest-bearing deposits with banks .................................................. 7,617 3,399
Federal funds sold and securities purchased under agreements to resell ....................... 1342
Total cash and cash equivalents ........................................................ 11,058 5,838
Restricted cash for securitization investors ............................................... 428 791
Securities available for sale, at fair value ................................................. 63,979 38,759
Loans held for investment:
Unsecuritized loans held for investment, at amortized cost ................................. 162,059 88,242
Restricted loans for securitization investors ............................................. 43,830 47,650
Total loans held for investment ........................................................ 205,889 135,892
Less: Allowance for loan and lease losses .............................................. (5,156) (4,250)
Net loans held for investment .......................................................... 200,733 131,642
Loans held for sale, at lower of cost or fair value .......................................... 201 201
Premises and equipment, net .......................................................... 3,587 2,748
Interest receivable ................................................................... 1,694 1,029
Goodwill .......................................................................... 13,904 13,592
Other ............................................................................. 17,334 11,419
Total assets ....................................................................... $312,918 $206,019
Liabilities:
Interest payable ..................................................................... $ 450 $ 466
Customer deposits:
Non-interest bearing deposits ........................................................ 22,467 18,281
Interest bearing deposits ............................................................ 190,018 109,945
Total customer deposits .............................................................. 212,485 128,226
Securitized debt obligations ........................................................... 11,398 16,527
Other debt:
Federal funds purchased and securities loaned or sold under agreements to repurchase ........... 1,248 1,464
Senior and subordinated notes ....................................................... 12,686 11,034
Other borrowings ................................................................. 24,578 10,536
Total other debt ..................................................................... 38,512 23,034
Other liabilities ..................................................................... 9,574 8,100
Total liabilities ..................................................................... 272,419 176,353
Commitments, contingencies and guarantees (see Note 21)
Stockholders’ equity:
Preferred stock, par value $.01 per share; 50,000,000 shares authorized; 875,000 shares and zero
shares issued and outstanding as of December 31, 2012 and 2011, respectively ................. 00
Common stock, par value $.01 per share; 1,000,000,000 shares authorized; 631,806,585 and
508,594,308 shares issued as of December 31, 2012 and 2011, respectively, and 582,207,133 and
459,947,217 shares outstanding as of December 31, 2012 and 2011, respectively ............... 65
Additional paid-in capital, net ......................................................... 26,188 19,274
Retained earnings ................................................................... 16,853 13,462
Accumulated other comprehensive income ............................................... 739 169
Less: Treasury stock, at cost; par value $.01 per share; 49,599,452 and 48,647,091 shares as of
December 31, 2012 and 2011, respectively ............................................. (3,287) (3,244)
Total stockholders’ equity ........................................................... 40,499 29,666
Total liabilities and stockholders’ equity ............................................... $312,918 $206,019
See Notes to Consolidated Financial Statements.
134