Capital One 2012 Annual Report Download - page 161
Download and view the complete annual report
Please find page 161 of the 2012 Capital One annual report below. You can navigate through the pages in the report by either clicking on the pages listed below, or by using the keyword search tool below to find specific information within the annual report.-
 1
1 -
2
-
3
-
4
-
5
-
6
-
7
-
8
-
9
-
10
-
11
-
12
-
13
-
14
-
15
-
16
-
17
-
18
-
19
-
20
-
21
-
22
-
23
-
24
-
25
-
26
-
27
-
28
-
29
-
30
-
31
-
32
-
33
-
34
-
35
-
36
-
37
-
38
-
39
-
40
-
41
-
42
-
43
-
44
-
45
-
46
-
47
-
48
-
49
-
50
-
51
-
52
-
53
-
54
-
55
-
56
-
57
-
58
-
59
-
60
-
61
-
62
-
63
-
64
-
65
-
66
-
67
-
68
-
69
-
70
-
71
-
72
-
73
-
74
-
75
-
76
-
77
-
78
-
79
-
80
-
81
-
82
-
83
-
84
-
85
-
86
-
87
-
88
-
89
-
90
-
91
-
92
-
93
-
94
-
95
-
96
-
97
-
98
-
99
-
100
-
101
-
102
-
103
-
104
-
105
-
106
-
107
-
108
-
109
-
110
-
111
-
112
-
113
-
114
-
115
-
116
-
117
-
118
-
119
-
120
-
121
-
122
-
123
-
124
-
125
-
126
-
127
-
128
-
129
-
130
-
131
-
132
-
133
-
134
-
135
-
136
-
137
-
138
-
139
-
140
-
141
-
142
-
143
-
144
-
145
-
146
-
147
-
148
-
149
-
150
-
 151
151 -
 152
152 -
 153
153 -
 154
154 -
 155
155 -
 156
156 -
 157
157 -
 158
158 -
 159
159 -
 160
160 -
 161
161 -
 162
162 -
 163
163 -
 164
164 -
 165
165 -
 166
166 -
 167
167 -
 168
168 -
 169
169 -
 170
170 -
 171
171 -
172
-
173
-
174
-
175
-
176
-
177
-
178
-
179
-
180
-
181
-
182
-
183
-
184
-
185
-
186
-
187
-
188
-
189
-
190
-
191
-
192
-
193
-
194
-
195
-
196
-
197
-
198
-
199
-
200
-
201
-
202
-
203
-
204
-
205
-
206
-
207
-
208
-
209
-
210
-
211
-
212
-
213
-
214
-
215
-
216
-
217
-
218
-
219
-
220
-
221
-
222
-
223
-
224
-
225
-
226
-
227
-
228
-
229
-
230
-
231
-
232
-
233
-
234
-
235
-
236
-
237
-
238
-
239
-
240
-
241
-
242
-
243
-
244
-
245
-
246
-
247
-
248
-
249
-
250
-
251
-
252
-
253
-
254
-
255
-
256
-
257
-
258
-
259
-
260
-
261
-
262
-
263
-
264
-
265
-
266
-
267
-
268
-
269
-
270
-
271
-
272
-
273
-
274
-
275
-
276
-
277
-
278
-
279
-
280
-
281
-
282
-
283
-
284
-
285
-
286
-
287
-
288
-
289
-
290
-
291
-
292
-
293
-
294
-
295
-
296
-
297
-
298
-
299
-
300
-
301
-
302
-
303
-
304
-
305
-
306
-
307
-
308
-
309
-
310
-
311
 |
 |

CAPITAL ONE FINANCIAL CORPORATION
NOTES TO CONSOLIDATED FINANCIAL STATEMENTS—(Continued)
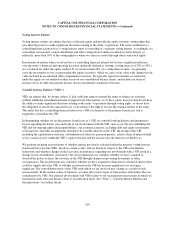
value as determined on an aggregate homogeneous portfolio basis, with any write-downs or recoveries in fair
value up to the amortized cost recorded in our consolidated statements of income as a component of other non-
interest income. We recognize interest on loans held for sale on an accrual basis. Because loans held for sale are
reported at lower of cost or fair value, an allowance for loan losses is not established for loans held for sale. The
fair value of loans held for sale is estimated based on secondary market prices for loan portfolios with similar
characteristics.
We execute whole loan sales with either servicing rights released to the buyer or retained. When loans are sold
and the servicing rights are released to the buyer, the gain or loss recognized on the sale is calculated based on
the difference between the proceeds received and the carrying value of the loans sold. When loans are sold and
the servicing rights are retained, the fair value attributed to the retained servicing rights impacts the gain or loss
recognized on the sale. We report gains or losses on loans held for sale when realized in other non-interest
income.
We originated $1.6 billion, $954 million and $1.2 billion of conforming residential mortgage loans in 2012, 2011
and 2010, respectively. We retained servicing on approximately 92%, 91% and 82% of the conforming
residential mortgage loans we sold in 2012, 2011 and 2010, respectively, and recognized gains of $58 million,
$28 million and $1 million on the sale of held-for-sale loans in 2012, 2011, and 2010, respectively.
Loan Transfers
In certain circumstances, we may transfer loans to/from held for sale or held for investment based on a change in
strategy. We transfer these loans at the lower of cost or fair value on the date of transfer and establish a new cost
basis upon transfer. If the decline in fair value upon transfer from held for investment to held for sale is related to
credit, the change in value is recorded as a charge-off at the time of transfer. If the decline is related to other
factors, the change in value is charged to non-interest expense. Further declines in fair value will result in the
establishment of a valuation allowance. Additionally, the amortization of deferred loan origination fees and direct
loan origination fees ceases upon transfer.
Loans Acquired
All purchased loans, including loans transferred in a business combination, acquired on or after January 1, 2009,
are recorded at fair value as of the date of each acquisition. Accordingly, any related allowance for loan losses is
not carried over. We purchase loans with and without evidence of credit deterioration since origination.
Subsequent to acquisition, we are required to account for purchased loans with evidence of credit deterioration
since origination and for which it is probable that we will not collect all contractually required principal and
interest payments based on expected cash flows. We also may elect to account for other purchased loans based on
expected cash flows.
Loans Acquired and Accounted for Based on Expected Cash Flows
In accounting for acquired loans based on expected cash flows, we first determine the contractually required
payments due, which represent the total undiscounted amount of all uncollected principal and interest payments,
adjusted for the effect of estimated prepayments. We then estimate the undiscounted cash flows we expect to
collect. We incorporate several key assumptions to estimate cash flows expected to be collected, including
default rates, loss severities and the amount and timing of prepayments. We estimate the fair value by
discounting the estimated cash flows we expect to collect using an observable market rate of interest, when
available, adjusted for factors that a market participant would consider in determining fair value. We are
142