Capital One 2012 Annual Report Download - page 187
Download and view the complete annual report
Please find page 187 of the 2012 Capital One annual report below. You can navigate through the pages in the report by either clicking on the pages listed below, or by using the keyword search tool below to find specific information within the annual report.-
 1
1 -
2
-
3
-
4
-
5
-
6
-
7
-
8
-
9
-
10
-
11
-
12
-
13
-
14
-
15
-
16
-
17
-
18
-
19
-
20
-
21
-
22
-
23
-
24
-
25
-
26
-
27
-
28
-
29
-
30
-
31
-
32
-
33
-
34
-
35
-
36
-
37
-
38
-
39
-
40
-
41
-
42
-
43
-
44
-
45
-
46
-
47
-
48
-
49
-
50
-
51
-
52
-
53
-
54
-
55
-
56
-
57
-
58
-
59
-
60
-
61
-
62
-
63
-
64
-
65
-
66
-
67
-
68
-
69
-
70
-
71
-
72
-
73
-
74
-
75
-
76
-
77
-
78
-
79
-
80
-
81
-
82
-
83
-
84
-
85
-
86
-
87
-
88
-
89
-
90
-
91
-
92
-
93
-
94
-
95
-
96
-
97
-
98
-
99
-
100
-
101
-
102
-
103
-
104
-
105
-
106
-
107
-
108
-
109
-
110
-
111
-
112
-
113
-
114
-
115
-
116
-
117
-
118
-
119
-
120
-
121
-
122
-
123
-
124
-
125
-
126
-
127
-
128
-
129
-
130
-
131
-
132
-
133
-
134
-
135
-
136
-
137
-
138
-
139
-
140
-
141
-
142
-
143
-
144
-
145
-
146
-
147
-
148
-
149
-
150
-
151
-
152
-
153
-
154
-
155
-
156
-
157
-
158
-
159
-
160
-
161
-
162
-
163
-
164
-
165
-
166
-
167
-
168
-
169
-
170
-
171
-
172
-
173
-
174
-
175
-
176
-
 177
177 -
 178
178 -
 179
179 -
 180
180 -
 181
181 -
 182
182 -
 183
183 -
 184
184 -
 185
185 -
 186
186 -
 187
187 -
 188
188 -
 189
189 -
 190
190 -
 191
191 -
 192
192 -
 193
193 -
 194
194 -
 195
195 -
 196
196 -
 197
197 -
198
-
199
-
200
-
201
-
202
-
203
-
204
-
205
-
206
-
207
-
208
-
209
-
210
-
211
-
212
-
213
-
214
-
215
-
216
-
217
-
218
-
219
-
220
-
221
-
222
-
223
-
224
-
225
-
226
-
227
-
228
-
229
-
230
-
231
-
232
-
233
-
234
-
235
-
236
-
237
-
238
-
239
-
240
-
241
-
242
-
243
-
244
-
245
-
246
-
247
-
248
-
249
-
250
-
251
-
252
-
253
-
254
-
255
-
256
-
257
-
258
-
259
-
260
-
261
-
262
-
263
-
264
-
265
-
266
-
267
-
268
-
269
-
270
-
271
-
272
-
273
-
274
-
275
-
276
-
277
-
278
-
279
-
280
-
281
-
282
-
283
-
284
-
285
-
286
-
287
-
288
-
289
-
290
-
291
-
292
-
293
-
294
-
295
-
296
-
297
-
298
-
299
-
300
-
301
-
302
-
303
-
304
-
305
-
306
-
307
-
308
-
309
-
310
-
311
 |
 |

CAPITAL ONE FINANCIAL CORPORATION
NOTES TO CONSOLIDATED FINANCIAL STATEMENTS—(Continued)
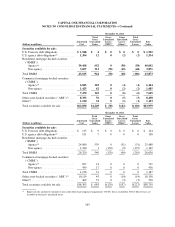
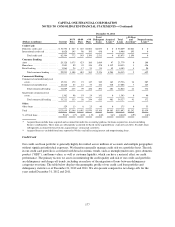
Because borrowers may have the right to call or prepay certain obligations, the expected maturities of our
securities are likely to differ from the scheduled contractual maturities presented above. The table below
summarizes, by major security type, the expected maturities and the weighted average yields of our investment
securities as of December 31, 2012. Actual calls or prepayment rates may differ from our estimates, which may
cause the actual maturities of our investment securities to differ from the expected maturities presented below.
December 31, 2012
Due in 1 Year
or Less
Due > 1 Year
through
5 Years
Due > 5 Years
through
10 Years Due > 10 Years Total
(Dollars in millions) Amount
Average
Yield(1) Amount
Average
Yield(1) Amount
Average
Yield(1) Amount
Average
Yield(1) Amount
Average
Yield(1)
Fair value of securities
available for sale:
U.S. Treasury debt
obligations ......... $ 702 0.21% $ 850 0.50% $ 0 0% $ 0 0% $ 1,552 0.37%
U.S. agency debt
obligations(2) ........ 103 4.59 66 2.32 1,131 1.75 14 3.48 1,314 2.01
RMBS:
Agency(3) ......... 1,539 2.93 22,350 2.77 15,787 2.58 326 3.13 40,002 2.70
Non-agency ....... 87 8.52 1,720 7.76 1,922 7.98 142 7.68 3,871 7.88
Total RMBS .......... 1,626 3.22 24,070 3.11 17,709 3.13 468 4.54 43,873 3.14
CMBS:
Agency(3) ......... 94 1.60 3,686 1.84 2,356 2.31 8 6.85 6,144 2.02
Non-agency ....... 305 3.73 279 3.47 901 3.22 0 0 1,485 3.38
Total CMBS .......... 399 3.23 3,965 1.95 3,257 2.55 8 6.85 7,629 2.28
ABS ................ 2,082 1.41 5,525 1.15 755 2.23 96 6.84 8,458 1.37
Other(4) .............. 455 0.71 495 1.55 76 2.35 127 0.04 1,153 1.13
Total securities available
for sale ............ $5,367 1.94% $34,971 2.58% $22,928 2.95% $713 4.17% $63,979 2.67%
Amortized cost of
securities available-
for-sale ............ $5,358 $34,318 $22,506 $668 $62,850
(1) Yields are calculated based on the amortized cost of each security.
(2) Consists of debt securities issued by Fannie Mae and Freddie Mac and other investments which are implicitly or explicitly guaranteed by
the U.S. government.
(3) Consists of mortgage-backed securities issued by Fannie Mae, Freddie Mac and Ginnie Mae.
(4) Yields of tax-exempt securities are calculated on a fully taxable-equivalent (“FTE”) basis.
Other-Than-Temporary Impairment
We evaluate all securities in an unrealized loss position at least quarterly, and more often as market conditions
require, to assess whether the impairment is other-than-temporary. Our OTTI assessment is a subjective process
requiring the use of judgments and assumptions. Accordingly, we consider a number of qualitative and
quantitative criteria in our assessment, including the extent and duration of the impairment; recent events specific
to the issuer and/or industry to which the issuer belongs; the payment structure of the security; external credit
ratings and the failure of the issuer to make scheduled interest or principal payments; the value of underlying
collateral; our intent and ability to hold the security; and current market conditions.
168