Capital One 2012 Annual Report Download - page 14
Download and view the complete annual report
Please find page 14 of the 2012 Capital One annual report below. You can navigate through the pages in the report by either clicking on the pages listed below, or by using the keyword search tool below to find specific information within the annual report.-
 1
1 -
2
-
3
-
 4
4 -
 5
5 -
 6
6 -
 7
7 -
 8
8 -
 9
9 -
 10
10 -
 11
11 -
 12
12 -
 13
13 -
 14
14 -
 15
15 -
 16
16 -
 17
17 -
 18
18 -
 19
19 -
 20
20 -
 21
21 -
 22
22 -
 23
23 -
 24
24 -
25
-
26
-
27
-
28
-
29
-
30
-
31
-
32
-
33
-
34
-
35
-
36
-
37
-
38
-
39
-
40
-
41
-
42
-
43
-
44
-
45
-
46
-
47
-
48
-
49
-
50
-
51
-
52
-
53
-
54
-
55
-
56
-
57
-
58
-
59
-
60
-
61
-
62
-
63
-
64
-
65
-
66
-
67
-
68
-
69
-
70
-
71
-
72
-
73
-
74
-
75
-
76
-
77
-
78
-
79
-
80
-
81
-
82
-
83
-
84
-
85
-
86
-
87
-
88
-
89
-
90
-
91
-
92
-
93
-
94
-
95
-
96
-
97
-
98
-
99
-
100
-
101
-
102
-
103
-
104
-
105
-
106
-
107
-
108
-
109
-
110
-
111
-
112
-
113
-
114
-
115
-
116
-
117
-
118
-
119
-
120
-
121
-
122
-
123
-
124
-
125
-
126
-
127
-
128
-
129
-
130
-
131
-
132
-
133
-
134
-
135
-
136
-
137
-
138
-
139
-
140
-
141
-
142
-
143
-
144
-
145
-
146
-
147
-
148
-
149
-
150
-
151
-
152
-
153
-
154
-
155
-
156
-
157
-
158
-
159
-
160
-
161
-
162
-
163
-
164
-
165
-
166
-
167
-
168
-
169
-
170
-
171
-
172
-
173
-
174
-
175
-
176
-
177
-
178
-
179
-
180
-
181
-
182
-
183
-
184
-
185
-
186
-
187
-
188
-
189
-
190
-
191
-
192
-
193
-
194
-
195
-
196
-
197
-
198
-
199
-
200
-
201
-
202
-
203
-
204
-
205
-
206
-
207
-
208
-
209
-
210
-
211
-
212
-
213
-
214
-
215
-
216
-
217
-
218
-
219
-
220
-
221
-
222
-
223
-
224
-
225
-
226
-
227
-
228
-
229
-
230
-
231
-
232
-
233
-
234
-
235
-
236
-
237
-
238
-
239
-
240
-
241
-
242
-
243
-
244
-
245
-
246
-
247
-
248
-
249
-
250
-
251
-
252
-
253
-
254
-
255
-
256
-
257
-
258
-
259
-
260
-
261
-
262
-
263
-
264
-
265
-
266
-
267
-
268
-
269
-
270
-
271
-
272
-
273
-
274
-
275
-
276
-
277
-
278
-
279
-
280
-
281
-
282
-
283
-
284
-
285
-
286
-
287
-
288
-
289
-
290
-
291
-
292
-
293
-
294
-
295
-
296
-
297
-
298
-
299
-
300
-
301
-
302
-
303
-
304
-
305
-
306
-
307
-
308
-
309
-
310
-
311
 |
 |
13
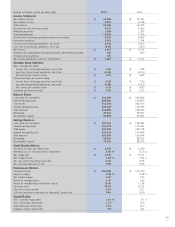
(Dollars in millions, except per share data) 2012 2011
Income Statement:
Net interest income $ 16,589 $ 12,741
Non-interest income 4,807 3,538
Total revenue 21,396 16,279
Provision for loan and lease losses 4,415 2,360
Marketing expenses 1,364 1,337
Operating expenses 10,582 7,995
Income from continuing operations before income taxes 5,035 4,587
Income tax provision 1,301 1,334
Income from continuing operations, net of tax 3,734 3,253
Loss from discontinued operations, net of tax (217) (106)
Net income $ 3,517 $ 3,147
Dividends and undistributed earnings allocated to participating securities (15) (26)
Preferred stock dividends (15) -
Net income available to common stockholders $ 3,487 $ 3,121
Common Share Statistics:
Basic earnings per share:
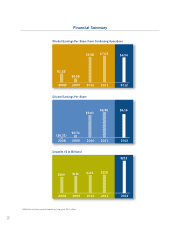
Income from continuing operations, net of tax $ 6.60 $ 7.08
Loss from discontinued operations, net of tax (0.39) (0.23)
Net income per common share $ 6.21 $ 6.85
Diluted earnings per common share:
Income from continuing operations, net of tax $ 6.54 $ 7.03
Loss from discontinued operations, net of tax (0.38) (0.23)
Net income per common share $ 6.16 $ 6.80
Dividends per common share $ 0.20 $ 0.20
Balance Sheet:
Loans held for investment $ 205,889 $ 135,892
Interest-earning assets 280,096 179,817
Total assets 312,918 206,019
Interest-bearing deposits 190,018 109,945
Total deposits 212,485 128,226
Borrowings 49,910 39,561
Stockholders’ equity 40,499 29,666
Average Balances:
Loans held for investment $ 187,915 $ 128,424
Interest-earning assets 255,079 175,341
Total assets 286,602 199,718
Interest-bearing deposits 183,314 109,644
Total deposits 203,055 126,694
Borrowings 38,025 38,022
Stockholders’ equity 37,327 28,579
Credit Quality Metrics:
Allowance for loan and lease losses $ 5,156 $ 4,250
Allowance as a % of loans held for investment 2.50 % 3.13 %
Net charge-offs $ 3,555 $ 3,771
Net charge-off rate 1.89 % 2.94 %
30+ day performing delinquency rate 2.70 3.35
30+ day total delinquency rate 3.09 3.95
Performance Metrics:
Purchase volume $ 180,599 $ 135,120
Revenue margin 8.39 % 9.28 %
Net interest margin 6.50 7.27
Return on average assets 1.30 1.63
Return on average total stockholders’ equity 10.00 11.38
Efficiency ratio 55.83 57.33
Effective income tax rate 25.8 29.1
Full-time equivalent employees (in thousands), period end 39.6 30.5
Capital Ratios:
Tier 1 common equity ratio 11.0 % 9.7 %
Tier 1 risk-based capital ratio 11.3 12.0
Total risk-based capital ratio 13.6 14.9
Tangible common equity ratio 7.9 8.2