Capital One 2012 Annual Report Download - page 63
Download and view the complete annual report
Please find page 63 of the 2012 Capital One annual report below. You can navigate through the pages in the report by either clicking on the pages listed below, or by using the keyword search tool below to find specific information within the annual report.-
 1
1 -
2
-
3
-
4
-
5
-
6
-
7
-
8
-
9
-
10
-
11
-
12
-
13
-
14
-
15
-
16
-
17
-
18
-
19
-
20
-
21
-
22
-
23
-
24
-
25
-
26
-
27
-
28
-
29
-
30
-
31
-
32
-
33
-
34
-
35
-
36
-
37
-
38
-
39
-
40
-
41
-
42
-
43
-
44
-
45
-
46
-
47
-
48
-
49
-
50
-
51
-
52
-
 53
53 -
 54
54 -
 55
55 -
 56
56 -
 57
57 -
 58
58 -
 59
59 -
 60
60 -
 61
61 -
 62
62 -
 63
63 -
 64
64 -
 65
65 -
 66
66 -
 67
67 -
 68
68 -
 69
69 -
 70
70 -
 71
71 -
 72
72 -
 73
73 -
74
-
75
-
76
-
77
-
78
-
79
-
80
-
81
-
82
-
83
-
84
-
85
-
86
-
87
-
88
-
89
-
90
-
91
-
92
-
93
-
94
-
95
-
96
-
97
-
98
-
99
-
100
-
101
-
102
-
103
-
104
-
105
-
106
-
107
-
108
-
109
-
110
-
111
-
112
-
113
-
114
-
115
-
116
-
117
-
118
-
119
-
120
-
121
-
122
-
123
-
124
-
125
-
126
-
127
-
128
-
129
-
130
-
131
-
132
-
133
-
134
-
135
-
136
-
137
-
138
-
139
-
140
-
141
-
142
-
143
-
144
-
145
-
146
-
147
-
148
-
149
-
150
-
151
-
152
-
153
-
154
-
155
-
156
-
157
-
158
-
159
-
160
-
161
-
162
-
163
-
164
-
165
-
166
-
167
-
168
-
169
-
170
-
171
-
172
-
173
-
174
-
175
-
176
-
177
-
178
-
179
-
180
-
181
-
182
-
183
-
184
-
185
-
186
-
187
-
188
-
189
-
190
-
191
-
192
-
193
-
194
-
195
-
196
-
197
-
198
-
199
-
200
-
201
-
202
-
203
-
204
-
205
-
206
-
207
-
208
-
209
-
210
-
211
-
212
-
213
-
214
-
215
-
216
-
217
-
218
-
219
-
220
-
221
-
222
-
223
-
224
-
225
-
226
-
227
-
228
-
229
-
230
-
231
-
232
-
233
-
234
-
235
-
236
-
237
-
238
-
239
-
240
-
241
-
242
-
243
-
244
-
245
-
246
-
247
-
248
-
249
-
250
-
251
-
252
-
253
-
254
-
255
-
256
-
257
-
258
-
259
-
260
-
261
-
262
-
263
-
264
-
265
-
266
-
267
-
268
-
269
-
270
-
271
-
272
-
273
-
274
-
275
-
276
-
277
-
278
-
279
-
280
-
281
-
282
-
283
-
284
-
285
-
286
-
287
-
288
-
289
-
290
-
291
-
292
-
293
-
294
-
295
-
296
-
297
-
298
-
299
-
300
-
301
-
302
-
303
-
304
-
305
-
306
-
307
-
308
-
309
-
310
-
311
 |
 |

EXECUTIVE SUMMARY AND BUSINESS OUTLOOK
In 2012, we completed two major acquisitions—ING Direct and the 2012 U.S. card acquisition. Certain purchase
accounting adjustments and other charges related to these acquisitions had a significant impact on our earnings in
2012 and resulted in volatility among quarterly results. The impact of the acquisition-related adjustments,
however, had diminished considerably by the end of the year. Our 2012 results reflected strong contributions
from the acquired businesses, as well as solid performance in our legacy businesses, despite the industry-wide
challenges of an uncertain and fragile economy, prolonged low interest rates and elevated regulatory expectations
facing all banks. Purchase volumes, revenues and credit performance remained strong in 2012, and our earnings,
together with capital raised from equity issuances during the year, further bolstered our liquidity and regulatory
capital position.
We continue to devote significant effort to integrating the operations of these acquired businesses and investing
in franchise enhancements. The combination of the ING Direct and 2012 U.S. card acquisitions has shifted the
mix of our interest-earning assets and driven substantial growth in our total net revenues, putting us in what we
believe is a strong position to generate capital and deliver sustained shareholder value, even in the current
environment of low industry growth and prolonged low interest rates.
Financial Highlights
We reported net income of $3.5 billion ($6.16 per diluted share) on total net revenue of $21.4 billion in 2012,
with each of our three business segments contributing to our earnings. In comparison, we reported net income of
$3.1 billion ($6.80 per diluted share) on total net revenue of $16.3 billion in 2011 and net income of $2.7 billion
($6.01 per diluted share) on total net revenue of $16.2 billion in 2010.
Our Tier 1 common ratio, as calculated under Basel I, increased to 11.0% as of December 31, 2012, up from
9.7% as of December 31, 2011. The increase in our Tier 1 common ratio reflected strong internal capital
generation from earnings, as well as capital raised from equity issuances during the year. Based on our current
interpretation of the proposed rules for implementing Basel III, we believe we are well positioned to meet our
fully phased-in assumed Tier 1 common ratio target under Basel III of approximately 8.0% in early 2013. Our
Tier 1 risk-based capital ratio, as calculated under Basel I, was 11.3% as of December 31, 2012, down from
12.0% as of December 31, 2011. The decrease was primarily driven by the significant increase in risk-weighted
assets resulting from the ING Direct and 2012 U.S. card acquisitions, which more than offset the benefit of an
increase in Tier 1 capital. See “Capital Management” below for additional information.
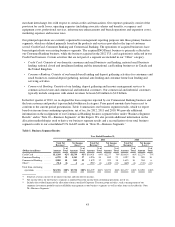
Below are additional highlights of our performance in 2012. These highlights generally are based on a
comparison between our 2012 and 2011 results, except as otherwise noted. The changes in our financial
condition and credit performance are generally based on our financial condition and credit performance as of
December 31, 2012, compared with our financial condition and credit performance as of December 31, 2011. We
provide a more detailed discussion of our financial performance in the sections following this “Executive
Summary and Business Outlook.”
Total Company
•Earnings: Our net income of $3.5 billion in 2012 increased by $370 million, or 12%, from 2011. The
increase in net income reflected the favorable impact of higher total net revenue from our legacy businesses,
increased revenues from acquired businesses and a bargain purchase gain of $594 million recorded at
closing of the ING Direct acquisition. The increase in net revenue was largely offset by post-acquisition
charges related to the 2012 U.S. card acquisition, including a provision for credit losses of $1.2 billion to
establish an initial allowance for the approximately $26.2 billion in outstanding credit card receivables from
the 2012 U.S. card acquisition designated as held for investment that had existing revolving privileges at
acquisition and an initial charge of $174 million to establish a reserve for estimated uncollectible billed
44