Capital One 2012 Annual Report Download - page 235
Download and view the complete annual report
Please find page 235 of the 2012 Capital One annual report below. You can navigate through the pages in the report by either clicking on the pages listed below, or by using the keyword search tool below to find specific information within the annual report.-
 1
1 -
2
-
3
-
4
-
5
-
6
-
7
-
8
-
9
-
10
-
11
-
12
-
13
-
14
-
15
-
16
-
17
-
18
-
19
-
20
-
21
-
22
-
23
-
24
-
25
-
26
-
27
-
28
-
29
-
30
-
31
-
32
-
33
-
34
-
35
-
36
-
37
-
38
-
39
-
40
-
41
-
42
-
43
-
44
-
45
-
46
-
47
-
48
-
49
-
50
-
51
-
52
-
53
-
54
-
55
-
56
-
57
-
58
-
59
-
60
-
61
-
62
-
63
-
64
-
65
-
66
-
67
-
68
-
69
-
70
-
71
-
72
-
73
-
74
-
75
-
76
-
77
-
78
-
79
-
80
-
81
-
82
-
83
-
84
-
85
-
86
-
87
-
88
-
89
-
90
-
91
-
92
-
93
-
94
-
95
-
96
-
97
-
98
-
99
-
100
-
101
-
102
-
103
-
104
-
105
-
106
-
107
-
108
-
109
-
110
-
111
-
112
-
113
-
114
-
115
-
116
-
117
-
118
-
119
-
120
-
121
-
122
-
123
-
124
-
125
-
126
-
127
-
128
-
129
-
130
-
131
-
132
-
133
-
134
-
135
-
136
-
137
-
138
-
139
-
140
-
141
-
142
-
143
-
144
-
145
-
146
-
147
-
148
-
149
-
150
-
151
-
152
-
153
-
154
-
155
-
156
-
157
-
158
-
159
-
160
-
161
-
162
-
163
-
164
-
165
-
166
-
167
-
168
-
169
-
170
-
171
-
172
-
173
-
174
-
175
-
176
-
177
-
178
-
179
-
180
-
181
-
182
-
183
-
184
-
185
-
186
-
187
-
188
-
189
-
190
-
191
-
192
-
193
-
194
-
195
-
196
-
197
-
198
-
199
-
200
-
201
-
202
-
203
-
204
-
205
-
206
-
207
-
208
-
209
-
210
-
211
-
212
-
213
-
214
-
215
-
216
-
217
-
218
-
219
-
220
-
221
-
222
-
223
-
224
-
 225
225 -
 226
226 -
 227
227 -
 228
228 -
 229
229 -
 230
230 -
 231
231 -
 232
232 -
 233
233 -
 234
234 -
 235
235 -
 236
236 -
 237
237 -
 238
238 -
 239
239 -
 240
240 -
 241
241 -
 242
242 -
 243
243 -
 244
244 -
 245
245 -
246
-
247
-
248
-
249
-
250
-
251
-
252
-
253
-
254
-
255
-
256
-
257
-
258
-
259
-
260
-
261
-
262
-
263
-
264
-
265
-
266
-
267
-
268
-
269
-
270
-
271
-
272
-
273
-
274
-
275
-
276
-
277
-
278
-
279
-
280
-
281
-
282
-
283
-
284
-
285
-
286
-
287
-
288
-
289
-
290
-
291
-
292
-
293
-
294
-
295
-
296
-
297
-
298
-
299
-
300
-
301
-
302
-
303
-
304
-
305
-
306
-
307
-
308
-
309
-
310
-
311
 |
 |

CAPITAL ONE FINANCIAL CORPORATION
NOTES TO CONSOLIDATED FINANCIAL STATEMENTS—(Continued)
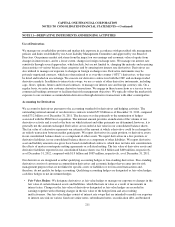
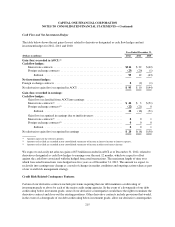
to demand immediate and ongoing full overnight collateralization on derivative instruments in a net liability
position. Certain of our derivative contracts may allow, in the event of a downgrade of our debt credit rating of
any kind, our derivative counterparties to demand additional collateralization on such derivative instruments in a
net liability position. The fair value of derivative instruments with credit-risk-related contingent features in a net
liability position was $7 million and $141 million as of December 31, 2012 and 2011, respectively. We were
required to post collateral, consisting of a combination of cash and securities, totaling $109 million and
$353 million as of December 31, 2012 and 2011, respectively. If our debt credit rating had fallen below
investment grade, we would have been required to post additional collateral of $4 million and $39 million as of
December 31, 2012 and 2011, respectively.
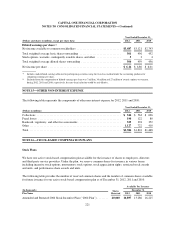
Derivative Counterparty Credit Risk
Derivative instruments contain an element of credit risk that arises from the potential failure of a counterparty to
perform according to the contractual terms of the contract. Our exposure to derivative counterparty credit risk, at
any point in time, is represented by the fair value of derivatives in a gain position, or derivative assets, assuming
no recoveries of underlying collateral. To mitigate the risk of counterparty default, we maintain collateral
agreements with certain derivative counterparties. These agreements typically require both parties to maintain
collateral in the event the fair values of derivative financial instruments exceed established thresholds. We
received cash collateral from derivatives counterparties totaling $922 million and $894 million as of
December 31, 2012 and 2011, respectively. We also received securities from derivatives counterparties totaling
$239 million as of December 31, 2012, which we have the ability to repledge. We posted cash collateral in
accounts maintained by derivative counterparties totaling $109 million and $353 million as of December 31,
2012 and 2011, respectively.
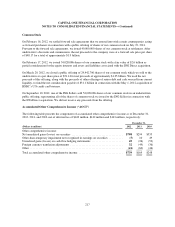
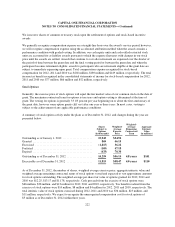
We record counterparty credit risk valuation adjustments on our derivative assets to properly reflect the credit
quality of the counterparty. We consider collateral and legally enforceable master netting agreements that
mitigate our credit exposure to each counterparty in determining the counterparty credit risk valuation
adjustment, which may be adjusted in future periods due to changes in the fair value of the derivative contract,
collateral and creditworthiness of the counterparty. The cumulative counterparty credit risk valuation adjustment
recorded on our consolidated balance sheets as a reduction in the derivative asset balance was $9 million and
$25 million as of December 31, 2012 and 2011, respectively. We also adjust the fair value of our derivative
liabilities to reflect the impact of our credit quality. We calculate this adjustment by comparing the spreads on
our credit default swaps to the discount benchmark curve. The cumulative credit risk valuation adjustment related
to our credit quality recorded on our consolidated balance sheets as a reduction in the derivative liability balance
was $1 million and $2 million as of December 31, 2012 and 2011, respectively.
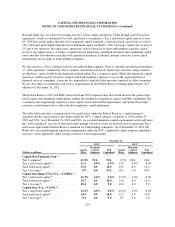
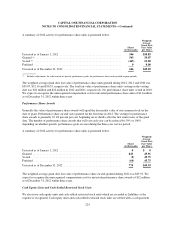
NOTE 12—STOCKHOLDERS’ EQUITY
Preferred Stock
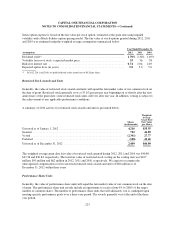
On August 20, 2012, we issued and sold 35,000,000 depositary shares (“Depositary Shares”), each representing a
1/40th interest in a share of Fixed Rate Non-Cumulative Perpetual Preferred Stock, Series B, $0.01 par value,
with a liquidation preference of $25.00 per Depositary Share (equivalent to $1,000 per share of Series B
Preferred Stock) (the “Series B Preferred Stock”). Dividends will accrue on the Series B Preferred Stock at a rate
of 6% per annum, payable quarterly in arrears. The net proceeds of the offering of the 35,000,000 Depositary
Shares were approximately $853 million, after deducting underwriting commissions and offering expenses.
216