Capital One 2012 Annual Report Download - page 131
Download and view the complete annual report
Please find page 131 of the 2012 Capital One annual report below. You can navigate through the pages in the report by either clicking on the pages listed below, or by using the keyword search tool below to find specific information within the annual report.-
 1
1 -
2
-
3
-
4
-
5
-
6
-
7
-
8
-
9
-
10
-
11
-
12
-
13
-
14
-
15
-
16
-
17
-
18
-
19
-
20
-
21
-
22
-
23
-
24
-
25
-
26
-
27
-
28
-
29
-
30
-
31
-
32
-
33
-
34
-
35
-
36
-
37
-
38
-
39
-
40
-
41
-
42
-
43
-
44
-
45
-
46
-
47
-
48
-
49
-
50
-
51
-
52
-
53
-
54
-
55
-
56
-
57
-
58
-
59
-
60
-
61
-
62
-
63
-
64
-
65
-
66
-
67
-
68
-
69
-
70
-
71
-
72
-
73
-
74
-
75
-
76
-
77
-
78
-
79
-
80
-
81
-
82
-
83
-
84
-
85
-
86
-
87
-
88
-
89
-
90
-
91
-
92
-
93
-
94
-
95
-
96
-
97
-
98
-
99
-
100
-
101
-
102
-
103
-
104
-
105
-
106
-
107
-
108
-
109
-
110
-
111
-
112
-
113
-
114
-
115
-
116
-
117
-
118
-
119
-
120
-
 121
121 -
 122
122 -
 123
123 -
 124
124 -
 125
125 -
 126
126 -
 127
127 -
 128
128 -
 129
129 -
 130
130 -
 131
131 -
 132
132 -
 133
133 -
 134
134 -
 135
135 -
 136
136 -
 137
137 -
 138
138 -
 139
139 -
 140
140 -
 141
141 -
142
-
143
-
144
-
145
-
146
-
147
-
148
-
149
-
150
-
151
-
152
-
153
-
154
-
155
-
156
-
157
-
158
-
159
-
160
-
161
-
162
-
163
-
164
-
165
-
166
-
167
-
168
-
169
-
170
-
171
-
172
-
173
-
174
-
175
-
176
-
177
-
178
-
179
-
180
-
181
-
182
-
183
-
184
-
185
-
186
-
187
-
188
-
189
-
190
-
191
-
192
-
193
-
194
-
195
-
196
-
197
-
198
-
199
-
200
-
201
-
202
-
203
-
204
-
205
-
206
-
207
-
208
-
209
-
210
-
211
-
212
-
213
-
214
-
215
-
216
-
217
-
218
-
219
-
220
-
221
-
222
-
223
-
224
-
225
-
226
-
227
-
228
-
229
-
230
-
231
-
232
-
233
-
234
-
235
-
236
-
237
-
238
-
239
-
240
-
241
-
242
-
243
-
244
-
245
-
246
-
247
-
248
-
249
-
250
-
251
-
252
-
253
-
254
-
255
-
256
-
257
-
258
-
259
-
260
-
261
-
262
-
263
-
264
-
265
-
266
-
267
-
268
-
269
-
270
-
271
-
272
-
273
-
274
-
275
-
276
-
277
-
278
-
279
-
280
-
281
-
282
-
283
-
284
-
285
-
286
-
287
-
288
-
289
-
290
-
291
-
292
-
293
-
294
-
295
-
296
-
297
-
298
-
299
-
300
-
301
-
302
-
303
-
304
-
305
-
306
-
307
-
308
-
309
-
310
-
311
 |
 |

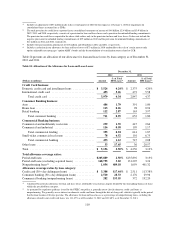
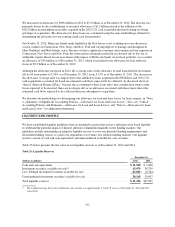
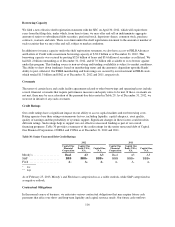
Our liquidity reserves increased by $25.4 billion, or 71%, in 2012, to $61.2 billion as of December 31, 2012. This
increase reflected the addition of $30.2 billion of investment securities available for sale from the ING Direct
acquisition, which was partially offset by the sale of $16.9 billion of investment securities. It also reflects an
increase of $5.2 billion in cash and cash equivalents, which includes higher cash held as of December 31, 2012 in
anticipation of the January 2, 2013 redemption of the $3.65 billion in trust preferred securities.
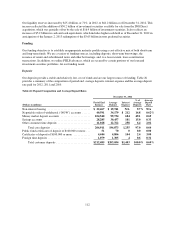
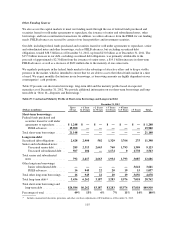
Funding
Our funding objective is to establish an appropriate maturity profile using a cost-effective mix of both short-term
and long-term funds. We use a variety of funding sources, including deposits, short-term borrowings, the
issuance of senior and subordinated notes and other borrowings, and, to a lesser extent, loan securitization
transactions. In addition, we utilize FHLB advances, which are secured by certain portions of our loan and
investment securities portfolios, for our funding needs.
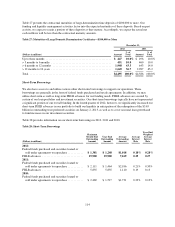
Deposits
Our deposits provide a stable and relatively low cost of funds and are our largest source of funding. Table 26
provides a summary of the composition of period end, average deposits, interest expense and the average deposit
rate paid for 2012, 2011 and 2010.
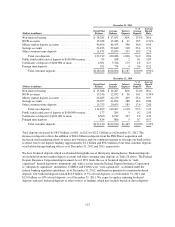
Table 26: Deposit Composition and Average Deposit Rates
December 31, 2012
(Dollars in millions)
Period End
Balance
Average
Balance
Interest
Expense
% of
Average
Deposits
Average
Deposit
Rate
Non-interest bearing .............................. $ 22,467 $ 19,741 N/A 9.7% N/A
Negotiable order of withdrawal (“NOW”) accounts ...... 40,591 34,179 $ 212 16.8 0.62%
Money market deposit accounts ..................... 104,540 99,734 684 49.1 0.69
Savings accounts ................................. 28,285 30,457 101 15.0 0.33
Other consumer time deposits ....................... 11,028 12,762 258 6.4 2.02
Total core deposits ............................ 206,911 196,873 1,255 97.0 0.64
Public fund certificates of deposit of $100,000 or more . . . 51 70 0 0.0 0.00
Certificates of deposit of $100,000 or more ............ 4,444 4,806 144 2.4 3.00
Foreign time deposits .............................. 1,079 1,305 4 0.6 0.31
Total customer deposits ........................ $212,485 $203,054 $1,403 100.0% 0.69%
112