Capital One 2012 Annual Report Download - page 255
Download and view the complete annual report
Please find page 255 of the 2012 Capital One annual report below. You can navigate through the pages in the report by either clicking on the pages listed below, or by using the keyword search tool below to find specific information within the annual report.-
 1
1 -
2
-
3
-
4
-
5
-
6
-
7
-
8
-
9
-
10
-
11
-
12
-
13
-
14
-
15
-
16
-
17
-
18
-
19
-
20
-
21
-
22
-
23
-
24
-
25
-
26
-
27
-
28
-
29
-
30
-
31
-
32
-
33
-
34
-
35
-
36
-
37
-
38
-
39
-
40
-
41
-
42
-
43
-
44
-
45
-
46
-
47
-
48
-
49
-
50
-
51
-
52
-
53
-
54
-
55
-
56
-
57
-
58
-
59
-
60
-
61
-
62
-
63
-
64
-
65
-
66
-
67
-
68
-
69
-
70
-
71
-
72
-
73
-
74
-
75
-
76
-
77
-
78
-
79
-
80
-
81
-
82
-
83
-
84
-
85
-
86
-
87
-
88
-
89
-
90
-
91
-
92
-
93
-
94
-
95
-
96
-
97
-
98
-
99
-
100
-
101
-
102
-
103
-
104
-
105
-
106
-
107
-
108
-
109
-
110
-
111
-
112
-
113
-
114
-
115
-
116
-
117
-
118
-
119
-
120
-
121
-
122
-
123
-
124
-
125
-
126
-
127
-
128
-
129
-
130
-
131
-
132
-
133
-
134
-
135
-
136
-
137
-
138
-
139
-
140
-
141
-
142
-
143
-
144
-
145
-
146
-
147
-
148
-
149
-
150
-
151
-
152
-
153
-
154
-
155
-
156
-
157
-
158
-
159
-
160
-
161
-
162
-
163
-
164
-
165
-
166
-
167
-
168
-
169
-
170
-
171
-
172
-
173
-
174
-
175
-
176
-
177
-
178
-
179
-
180
-
181
-
182
-
183
-
184
-
185
-
186
-
187
-
188
-
189
-
190
-
191
-
192
-
193
-
194
-
195
-
196
-
197
-
198
-
199
-
200
-
201
-
202
-
203
-
204
-
205
-
206
-
207
-
208
-
209
-
210
-
211
-
212
-
213
-
214
-
215
-
216
-
217
-
218
-
219
-
220
-
221
-
222
-
223
-
224
-
225
-
226
-
227
-
228
-
229
-
230
-
231
-
232
-
233
-
234
-
235
-
236
-
237
-
238
-
239
-
240
-
241
-
242
-
243
-
244
-
 245
245 -
 246
246 -
 247
247 -
 248
248 -
 249
249 -
 250
250 -
 251
251 -
 252
252 -
 253
253 -
 254
254 -
 255
255 -
 256
256 -
 257
257 -
 258
258 -
 259
259 -
 260
260 -
 261
261 -
 262
262 -
 263
263 -
 264
264 -
 265
265 -
266
-
267
-
268
-
269
-
270
-
271
-
272
-
273
-
274
-
275
-
276
-
277
-
278
-
279
-
280
-
281
-
282
-
283
-
284
-
285
-
286
-
287
-
288
-
289
-
290
-
291
-
292
-
293
-
294
-
295
-
296
-
297
-
298
-
299
-
300
-
301
-
302
-
303
-
304
-
305
-
306
-
307
-
308
-
309
-
310
-
311
 |
 |

CAPITAL ONE FINANCIAL CORPORATION
NOTES TO CONSOLIDATED FINANCIAL STATEMENTS—(Continued)
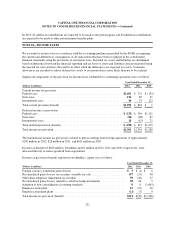
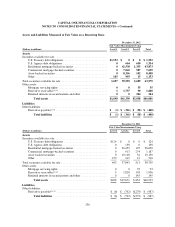
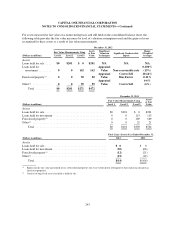
Assets and Liabilities Measured at Fair Value on a Recurring Basis
December 31, 2012
Fair Value Measurements Using
(Dollars in millions) Level 1 Level 2 Level 3 Total
Assets
Securities available for sale: ....................................
U.S. Treasury debt obligations .............................. $1,552 $ 0 $ 0 $ 1,552
U.S. Agency debt obligations ............................... 0 664 650 1,314
Residential mortgage-backed securities ....................... 0 42,538 1,335 43,873
Commercial mortgage-backed securities ...................... 0 7,042 587 7,629
Asset-backed securities .................................... 0 8,356 102 8,458
Other .................................................. 145 993 15 1,153
Total securities available for sale ................................ 1,697 59,593 2,689 63,979
Other assets: ................................................
Mortgage servicing rights .................................. 0 0 55 55
Derivative receivables(1)(2) .................................. 1 1,757 90 1,848
Retained interests in securitizations and other .................. 0 0 204 204
Total assets ......................................... $1,698 $61,350 $3,038 $66,086
Liabilities
Other liabilities: ..............................................
Derivative payables(1)(2) .................................... $ (1) $ (361) $ (38) $ (400)
Total liabilities ...................................... $ (1) $ (361) $ (38) $ (400)
December 31, 2011
Fair Value Measurements Using
(Dollars in millions) Level 1 Level 2 Level 3 Total
Assets
Securities available for sale: ....................................
U.S. Treasury debt obligations .............................. $124 $ 0 $ 0 $ 124
U.S. Agency debt obligations ............................... 0 138 0 138
Residential mortgage-backed securities ....................... 0 26,455 195 26,650
Commercial mortgage-backed securities ...................... 0 913 274 1,187
Asset-backed securities .................................... 0 10,118 32 10,150
Other .................................................. 279 219 12 510
Total securities available for sale ................................ 403 37,843 513 38,759
Other assets: ................................................
Mortgage servicing rights .................................. 0 0 93 93
Derivative receivables(1)(2) ................................. 5 1,828 103 1,936
Retained interests in securitizations and other .................. 0 0 145 145
Total assets ........................................ $408 $39,671 $ 854 $40,933
Liabilities
Other liabilities: .............................................
Derivative payables(1) (2) ................................... $ (6) $ (702) $(279) $ (987)
Total liabilities ...................................... $ (6) $ (702) $(279) $ (987)
236