Capital One 2012 Annual Report Download - page 182
Download and view the complete annual report
Please find page 182 of the 2012 Capital One annual report below. You can navigate through the pages in the report by either clicking on the pages listed below, or by using the keyword search tool below to find specific information within the annual report.-
 1
1 -
2
-
3
-
4
-
5
-
6
-
7
-
8
-
9
-
10
-
11
-
12
-
13
-
14
-
15
-
16
-
17
-
18
-
19
-
20
-
21
-
22
-
23
-
24
-
25
-
26
-
27
-
28
-
29
-
30
-
31
-
32
-
33
-
34
-
35
-
36
-
37
-
38
-
39
-
40
-
41
-
42
-
43
-
44
-
45
-
46
-
47
-
48
-
49
-
50
-
51
-
52
-
53
-
54
-
55
-
56
-
57
-
58
-
59
-
60
-
61
-
62
-
63
-
64
-
65
-
66
-
67
-
68
-
69
-
70
-
71
-
72
-
73
-
74
-
75
-
76
-
77
-
78
-
79
-
80
-
81
-
82
-
83
-
84
-
85
-
86
-
87
-
88
-
89
-
90
-
91
-
92
-
93
-
94
-
95
-
96
-
97
-
98
-
99
-
100
-
101
-
102
-
103
-
104
-
105
-
106
-
107
-
108
-
109
-
110
-
111
-
112
-
113
-
114
-
115
-
116
-
117
-
118
-
119
-
120
-
121
-
122
-
123
-
124
-
125
-
126
-
127
-
128
-
129
-
130
-
131
-
132
-
133
-
134
-
135
-
136
-
137
-
138
-
139
-
140
-
141
-
142
-
143
-
144
-
145
-
146
-
147
-
148
-
149
-
150
-
151
-
152
-
153
-
154
-
155
-
156
-
157
-
158
-
159
-
160
-
161
-
162
-
163
-
164
-
165
-
166
-
167
-
168
-
169
-
170
-
171
-
 172
172 -
 173
173 -
 174
174 -
 175
175 -
 176
176 -
 177
177 -
 178
178 -
 179
179 -
 180
180 -
 181
181 -
 182
182 -
 183
183 -
 184
184 -
 185
185 -
 186
186 -
 187
187 -
 188
188 -
 189
189 -
 190
190 -
 191
191 -
 192
192 -
193
-
194
-
195
-
196
-
197
-
198
-
199
-
200
-
201
-
202
-
203
-
204
-
205
-
206
-
207
-
208
-
209
-
210
-
211
-
212
-
213
-
214
-
215
-
216
-
217
-
218
-
219
-
220
-
221
-
222
-
223
-
224
-
225
-
226
-
227
-
228
-
229
-
230
-
231
-
232
-
233
-
234
-
235
-
236
-
237
-
238
-
239
-
240
-
241
-
242
-
243
-
244
-
245
-
246
-
247
-
248
-
249
-
250
-
251
-
252
-
253
-
254
-
255
-
256
-
257
-
258
-
259
-
260
-
261
-
262
-
263
-
264
-
265
-
266
-
267
-
268
-
269
-
270
-
271
-
272
-
273
-
274
-
275
-
276
-
277
-
278
-
279
-
280
-
281
-
282
-
283
-
284
-
285
-
286
-
287
-
288
-
289
-
290
-
291
-
292
-
293
-
294
-
295
-
296
-
297
-
298
-
299
-
300
-
301
-
302
-
303
-
304
-
305
-
306
-
307
-
308
-
309
-
310
-
311
 |
 |

CAPITAL ONE FINANCIAL CORPORATION
NOTES TO CONSOLIDATED FINANCIAL STATEMENTS—(Continued)
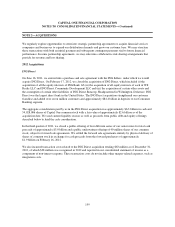
the ING Direct acquisition is a nonrecurring item, it is excluded from the pro forma results to present the
information on a more comparative basis.
The pro forma condensed combined financial information is presented for illustrative purposes only and does not
indicate the actual combined financial results had the closing of the ING Direct acquisition or the 2012 U.S. card
acquisition been completed on January 1, 2011 nor does it reflect the benefits obtained through the integration of
business operations realized since acquisition. Furthermore, the information is not indicative of the results of
operations in future periods. The pro forma condensed combined financial information does not reflect the
impact of possible business model changes nor does it consider any potential impacts of market conditions,
expense efficiencies or other factors.
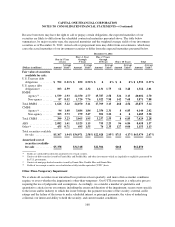
ING Direct
Impact
HSBC
Impact
Condensed
Combined
Pro Forma
Results
From February 17,
2012 through
From May 1,
2012 through
Year Ended
December 31,
(Dollars in millions) December 31, 2012 December 31, 2012 2012 2011
Revenue(1) .............................. $ 1,754 $ 3,186 $24,910 $26,265
Income from continuing operations, net of
tax .................................. 334 (377) 3,211 4,596
(1) The amounts reported consist of gross interest income and gross non-interest income. Net revenue for ING Direct was $1.2 billion from
acquisition on February 17, 2012 through December 31, 2012. Net revenue for HSBC was $2.9 billion from acquisition on May 1, 2012
through December 31, 2012. Net revenue includes interest income, non-interest income and interest expense.
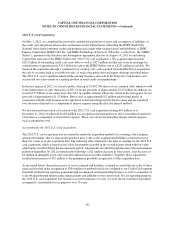
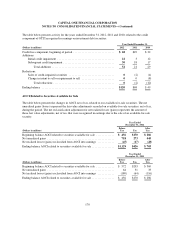
NOTE 3—DISCONTINUED OPERATIONS
Shutdown of Mortgage Origination Operations of our Wholesale Mortgage Banking Unit
In the third quarter of 2007, we closed the mortgage origination operations of our wholesale mortgage banking
unit, GreenPoint, which was acquired by us in December 2006 as part of the North Fork acquisition. The results
of the wholesale banking unit have been accounted for as a discontinued operation and are therefore not included
in our results from continuing operations in 2012, 2011 and 2010. We have no significant continuing
involvement in these operations.
The following table summarizes the results from discontinued operations related to the closure of our wholesale
mortgage banking unit:
Year Ended December 31,
(Dollars in millions) 2012 2011 2010
Net interest expense ...................................................... $0$ 0 $ (1)
Non-interest expense, net .................................................. (343) (168) (475)
Loss from discontinued operations before tax .................................. (343) (168) (476)
Income tax benefit ........................................................ (126) (62) (169)
Loss from discontinued operations, net of tax .................................. $(217) $(106) $(307)
163