Capital One 2012 Annual Report Download - page 242
Download and view the complete annual report
Please find page 242 of the 2012 Capital One annual report below. You can navigate through the pages in the report by either clicking on the pages listed below, or by using the keyword search tool below to find specific information within the annual report.-
 1
1 -
2
-
3
-
4
-
5
-
6
-
7
-
8
-
9
-
10
-
11
-
12
-
13
-
14
-
15
-
16
-
17
-
18
-
19
-
20
-
21
-
22
-
23
-
24
-
25
-
26
-
27
-
28
-
29
-
30
-
31
-
32
-
33
-
34
-
35
-
36
-
37
-
38
-
39
-
40
-
41
-
42
-
43
-
44
-
45
-
46
-
47
-
48
-
49
-
50
-
51
-
52
-
53
-
54
-
55
-
56
-
57
-
58
-
59
-
60
-
61
-
62
-
63
-
64
-
65
-
66
-
67
-
68
-
69
-
70
-
71
-
72
-
73
-
74
-
75
-
76
-
77
-
78
-
79
-
80
-
81
-
82
-
83
-
84
-
85
-
86
-
87
-
88
-
89
-
90
-
91
-
92
-
93
-
94
-
95
-
96
-
97
-
98
-
99
-
100
-
101
-
102
-
103
-
104
-
105
-
106
-
107
-
108
-
109
-
110
-
111
-
112
-
113
-
114
-
115
-
116
-
117
-
118
-
119
-
120
-
121
-
122
-
123
-
124
-
125
-
126
-
127
-
128
-
129
-
130
-
131
-
132
-
133
-
134
-
135
-
136
-
137
-
138
-
139
-
140
-
141
-
142
-
143
-
144
-
145
-
146
-
147
-
148
-
149
-
150
-
151
-
152
-
153
-
154
-
155
-
156
-
157
-
158
-
159
-
160
-
161
-
162
-
163
-
164
-
165
-
166
-
167
-
168
-
169
-
170
-
171
-
172
-
173
-
174
-
175
-
176
-
177
-
178
-
179
-
180
-
181
-
182
-
183
-
184
-
185
-
186
-
187
-
188
-
189
-
190
-
191
-
192
-
193
-
194
-
195
-
196
-
197
-
198
-
199
-
200
-
201
-
202
-
203
-
204
-
205
-
206
-
207
-
208
-
209
-
210
-
211
-
212
-
213
-
214
-
215
-
216
-
217
-
218
-
219
-
220
-
221
-
222
-
223
-
224
-
225
-
226
-
227
-
228
-
229
-
230
-
231
-
 232
232 -
 233
233 -
 234
234 -
 235
235 -
 236
236 -
 237
237 -
 238
238 -
 239
239 -
 240
240 -
 241
241 -
 242
242 -
 243
243 -
 244
244 -
 245
245 -
 246
246 -
 247
247 -
 248
248 -
 249
249 -
 250
250 -
 251
251 -
 252
252 -
253
-
254
-
255
-
256
-
257
-
258
-
259
-
260
-
261
-
262
-
263
-
264
-
265
-
266
-
267
-
268
-
269
-
270
-
271
-
272
-
273
-
274
-
275
-
276
-
277
-
278
-
279
-
280
-
281
-
282
-
283
-
284
-
285
-
286
-
287
-
288
-
289
-
290
-
291
-
292
-
293
-
294
-
295
-
296
-
297
-
298
-
299
-
300
-
301
-
302
-
303
-
304
-
305
-
306
-
307
-
308
-
309
-
310
-
311
 |
 |

CAPITAL ONE FINANCIAL CORPORATION
NOTES TO CONSOLIDATED FINANCIAL STATEMENTS—(Continued)
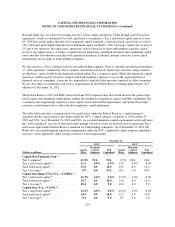
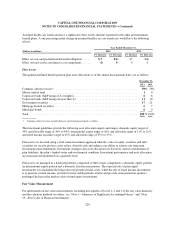
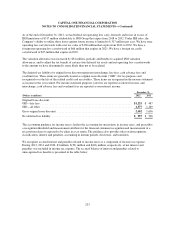
Stock option expense is based on the fair value per stock option, estimated at the grant date using implied
volatility with a Black-Scholes option-pricing model. The fair value of stock options granted during 2012, 2011
and 2010 was estimated using the weighted average assumptions summarized below:
Year Ended December 31,
Assumptions 2012 2011 2010
Dividend yield(1) ......................................................... 1.70% 2.34% 1.49%
Volatility factors of stock’s expected market price ............................... 35 36 38
Risk-free interest rate ..................................................... 0.74 2.04 2.49
Expected option lives (in years) ............................................. 5.0 5.0 5.0
(1) In 2012, 2011 and 2010, we paid dividends at the annual rate of $0.20 per share.
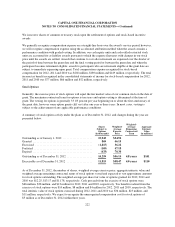
Restricted Stock Awards and Units
Generally, the value of restricted stock awards and units will equal the fair market value of our common stock on
the date of grant. Restricted stock generally vests at 33 1/3 percent per year beginning on or shortly after the first
anniversary of the grant date; some restricted stock units cliff vest after one year. In addition, vesting is subject to
the achievement of any applicable performance conditions.
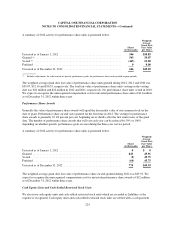
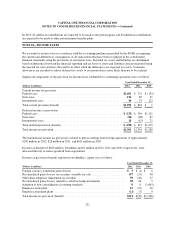
A summary of 2012 activity for restricted stock awards and units is presented below:
Shares
(in thousands)
Weighted-
Average
Grant Date
Fair Value
per Share
Unvested as of January 1, 2012 ........................................... 4,216 $35.55
Granted .............................................................. 722 46.89
Vested ............................................................... (2,341) 27.77
Forfeited ............................................................. (188) 41.46
Unvested as of December 31, 2012 ........................................ 2,409 $46.09
The weighted-average grant date fair value of restricted stock granted during 2012, 2011 and 2010 was $46.89,
$47.36 and $36.84, respectively. The total fair value of restricted stock vesting on the vesting date was $107
million, $95 million and $62 million in 2012, 2011 and 2010, respectively. We expect to recognize the
unrecognized compensation cost for unvested restricted stock awards and units of $40 million as of
December 31, 2012 within three years.
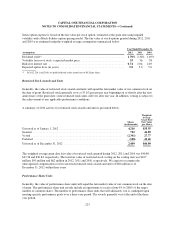
Performance Share Units
Generally, the value of performance share units will equal the fair market value of our common stock on the date
of grant. The performance share unit awards include an opportunity to receive from 0% to 200% of the target
number of common shares. The number of performance share units that will ultimately vest is contingent upon
meeting specific performance goals over a three-year period. The awards generally vest at the end of the three-
year period.
223