Capital One 2012 Annual Report Download - page 64
Download and view the complete annual report
Please find page 64 of the 2012 Capital One annual report below. You can navigate through the pages in the report by either clicking on the pages listed below, or by using the keyword search tool below to find specific information within the annual report.-
 1
1 -
2
-
3
-
4
-
5
-
6
-
7
-
8
-
9
-
10
-
11
-
12
-
13
-
14
-
15
-
16
-
17
-
18
-
19
-
20
-
21
-
22
-
23
-
24
-
25
-
26
-
27
-
28
-
29
-
30
-
31
-
32
-
33
-
34
-
35
-
36
-
37
-
38
-
39
-
40
-
41
-
42
-
43
-
44
-
45
-
46
-
47
-
48
-
49
-
50
-
51
-
52
-
53
-
 54
54 -
 55
55 -
 56
56 -
 57
57 -
 58
58 -
 59
59 -
 60
60 -
 61
61 -
 62
62 -
 63
63 -
 64
64 -
 65
65 -
 66
66 -
 67
67 -
 68
68 -
 69
69 -
 70
70 -
 71
71 -
 72
72 -
 73
73 -
 74
74 -
75
-
76
-
77
-
78
-
79
-
80
-
81
-
82
-
83
-
84
-
85
-
86
-
87
-
88
-
89
-
90
-
91
-
92
-
93
-
94
-
95
-
96
-
97
-
98
-
99
-
100
-
101
-
102
-
103
-
104
-
105
-
106
-
107
-
108
-
109
-
110
-
111
-
112
-
113
-
114
-
115
-
116
-
117
-
118
-
119
-
120
-
121
-
122
-
123
-
124
-
125
-
126
-
127
-
128
-
129
-
130
-
131
-
132
-
133
-
134
-
135
-
136
-
137
-
138
-
139
-
140
-
141
-
142
-
143
-
144
-
145
-
146
-
147
-
148
-
149
-
150
-
151
-
152
-
153
-
154
-
155
-
156
-
157
-
158
-
159
-
160
-
161
-
162
-
163
-
164
-
165
-
166
-
167
-
168
-
169
-
170
-
171
-
172
-
173
-
174
-
175
-
176
-
177
-
178
-
179
-
180
-
181
-
182
-
183
-
184
-
185
-
186
-
187
-
188
-
189
-
190
-
191
-
192
-
193
-
194
-
195
-
196
-
197
-
198
-
199
-
200
-
201
-
202
-
203
-
204
-
205
-
206
-
207
-
208
-
209
-
210
-
211
-
212
-
213
-
214
-
215
-
216
-
217
-
218
-
219
-
220
-
221
-
222
-
223
-
224
-
225
-
226
-
227
-
228
-
229
-
230
-
231
-
232
-
233
-
234
-
235
-
236
-
237
-
238
-
239
-
240
-
241
-
242
-
243
-
244
-
245
-
246
-
247
-
248
-
249
-
250
-
251
-
252
-
253
-
254
-
255
-
256
-
257
-
258
-
259
-
260
-
261
-
262
-
263
-
264
-
265
-
266
-
267
-
268
-
269
-
270
-
271
-
272
-
273
-
274
-
275
-
276
-
277
-
278
-
279
-
280
-
281
-
282
-
283
-
284
-
285
-
286
-
287
-
288
-
289
-
290
-
291
-
292
-
293
-
294
-
295
-
296
-
297
-
298
-
299
-
300
-
301
-
302
-
303
-
304
-
305
-
306
-
307
-
308
-
309
-
310
-
311
 |
 |
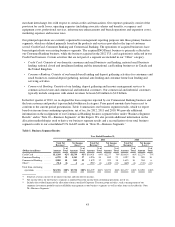
finance charges and fees for these loans. In addition, non-interest expense grew substantially due to higher
operating expenses and merger-related expenses related to our recent acquisitions, as well as higher
infrastructure expenses resulting from continued investments in our home and auto loan businesses.
•Total Loans: Period-end loans held for investment increased by $70.0 billion, or 52%, in 2012 to
$205.9 billion as of December 31, 2012, from $135.9 billion as of December 31, 2011. The increase was
primarily attributable to the addition of the acquired ING Direct loan portfolio of $40.4 billion and the
receivables acquired in the 2012 U.S. card acquisition designated as held for investment of $27.8 billion.
Excluding the impact of the addition of these loans, period-end loans held for investment increased by $1.8
billion, or 1%. The increase reflected strong commercial loan growth and continued growth in auto loans,
which was partially offset by the continued expected run-off of installment loans in our Credit Card business
and home loans in our Consumer Banking business.
•Charge-off and Delinquency Statistics: Our net charge-off rate decreased to 1.89% in 2012, from 2.94% in
2011. The 30+ day delinquency rate also declined during the year to 3.09% as of December 31, 2012, from
3.95% as of December 31, 2011. As discussed above, the accounting and classification of acquired loans
accounted for based on estimated cash flows expected to be collected may significantly alter some of our
reported credit quality metrics. The “credit mark” established in conjunction with acquired loans from the
ING Direct and 2012 U.S. card acquisitions absorbed a significant portion of the uncollectible amounts that
we would have recorded as charge-offs on these portfolios in the second and third quarters of 2012,
resulting in unusually low net-charge off rates in each of these quarters. By the fourth quarter of 2012, the
credit mark impact related to the 2012 U.S. card acquisition had diminished, with no meaningful impact on
net charge-offs in the quarter. We provide information on our credit quality metrics, excluding the impact of
acquired loans accounted for based on estimated cash flows expected to be collected, below under “Business
Segments” and “Credit Risk Profile.”
•Allowance for Loan and Lease Losses: We increased our allowance by $906 million in 2012 to $5.2 billion
as of December 31, 2012. In comparison, we reduced our allowance by $1.4 billion in 2011. The increase in
the allowance in 2012 was primarily attributable to the initial allowance build of $1.2 billion in the second
quarter of 2012 that we established for the approximately $26.2 billion in outstanding credit card receivables
from the 2012 U.S. card acquisition that had existing revolving privileges at acquisition, as well as growth
in auto loan balances. Excluding the initial allowance build of $1.2 billion established for the receivables
acquired in the 2012 U.S. card acquisition, we recorded an allowance release of $294 million in 2012
primarily attributable to a significant improvement in underlying credit performance trends in our
Commercial Banking business. Although the allowance increased in 2012, the coverage ratio of the
allowance to total loans held for investment fell to 2.50% as of December 31, 2012, from 3.13% as of
December 31, 2011. The decrease in the allowance coverage ratio was largely due to the (i) addition of the
receivables acquired in the ING Direct and 2012 U.S. card acquisitions accounted for based on estimated
cash flows expected to be collected, for which we did not record an allowance in accordance with the
required accounting guidance for these loans, and (ii) improved credit performance for our commercial loan
portfolio.
•Representation and Warranty Reserve: We recorded a provision for mortgage representation and warranty
losses of $349 million in 2012, compared with a provision of $212 million in 2011. The increase in the
provision in 2012 was primarily driven by updated estimates of anticipated outcomes from various litigation
and threatened litigation in the insured securitization segment based on relevant factual and legal
developments and settlements during the year with a government-sponsored enterprise (“GSE”) to resolve
present and future claims. Our representation and warranty reserve decreased to $899 million as of
December 31, 2012, from $943 million as of December 31, 2011, largely due to settlements during 2012. As
of December 31, 2012, our best estimate of reasonably possible future losses from representation and
warranty claims beyond what is in our reserve was approximately $2.7 billion, an increase from our
previous estimates of $1.7 billion as of September 30, 2012, and $1.5 billion as of December 31, 2011. We
provide additional information on the representation and warranty reserve in “Critical Accounting Policies
45