Capital One 2012 Annual Report Download - page 303
Download and view the complete annual report
Please find page 303 of the 2012 Capital One annual report below. You can navigate through the pages in the report by either clicking on the pages listed below, or by using the keyword search tool below to find specific information within the annual report.-
 1
1 -
2
-
3
-
4
-
5
-
6
-
7
-
8
-
9
-
10
-
11
-
12
-
13
-
14
-
15
-
16
-
17
-
18
-
19
-
20
-
21
-
22
-
23
-
24
-
25
-
26
-
27
-
28
-
29
-
30
-
31
-
32
-
33
-
34
-
35
-
36
-
37
-
38
-
39
-
40
-
41
-
42
-
43
-
44
-
45
-
46
-
47
-
48
-
49
-
50
-
51
-
52
-
53
-
54
-
55
-
56
-
57
-
58
-
59
-
60
-
61
-
62
-
63
-
64
-
65
-
66
-
67
-
68
-
69
-
70
-
71
-
72
-
73
-
74
-
75
-
76
-
77
-
78
-
79
-
80
-
81
-
82
-
83
-
84
-
85
-
86
-
87
-
88
-
89
-
90
-
91
-
92
-
93
-
94
-
95
-
96
-
97
-
98
-
99
-
100
-
101
-
102
-
103
-
104
-
105
-
106
-
107
-
108
-
109
-
110
-
111
-
112
-
113
-
114
-
115
-
116
-
117
-
118
-
119
-
120
-
121
-
122
-
123
-
124
-
125
-
126
-
127
-
128
-
129
-
130
-
131
-
132
-
133
-
134
-
135
-
136
-
137
-
138
-
139
-
140
-
141
-
142
-
143
-
144
-
145
-
146
-
147
-
148
-
149
-
150
-
151
-
152
-
153
-
154
-
155
-
156
-
157
-
158
-
159
-
160
-
161
-
162
-
163
-
164
-
165
-
166
-
167
-
168
-
169
-
170
-
171
-
172
-
173
-
174
-
175
-
176
-
177
-
178
-
179
-
180
-
181
-
182
-
183
-
184
-
185
-
186
-
187
-
188
-
189
-
190
-
191
-
192
-
193
-
194
-
195
-
196
-
197
-
198
-
199
-
200
-
201
-
202
-
203
-
204
-
205
-
206
-
207
-
208
-
209
-
210
-
211
-
212
-
213
-
214
-
215
-
216
-
217
-
218
-
219
-
220
-
221
-
222
-
223
-
224
-
225
-
226
-
227
-
228
-
229
-
230
-
231
-
232
-
233
-
234
-
235
-
236
-
237
-
238
-
239
-
240
-
241
-
242
-
243
-
244
-
245
-
246
-
247
-
248
-
249
-
250
-
251
-
252
-
253
-
254
-
255
-
256
-
257
-
258
-
259
-
260
-
261
-
262
-
263
-
264
-
265
-
266
-
267
-
268
-
269
-
270
-
271
-
272
-
273
-
274
-
275
-
276
-
277
-
278
-
279
-
280
-
281
-
282
-
283
-
284
-
285
-
286
-
287
-
288
-
289
-
290
-
291
-
292
-
 293
293 -
 294
294 -
 295
295 -
 296
296 -
 297
297 -
 298
298 -
 299
299 -
 300
300 -
 301
301 -
 302
302 -
 303
303 -
 304
304 -
 305
305 -
 306
306 -
 307
307 -
 308
308 -
 309
309 -
 310
310 -
 311
311
 |
 |

Exhibit 99.1
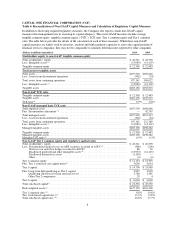
CAPITAL ONE FINANCIAL CORPORATION (COF)
Reconciliation of Non-GAAP Measures and Regulatory Capital Measures
We refer to our consolidated financial statements prepared in accordance with generally accepted accounting
principles in the U.S. (“U.S. GAAP”) as our “reported” or GAAP financial statements. Effective January 1, 2010,
we prospectively adopted two accounting standards related to the transfer and servicing of financial assets and
consolidations that changed how we account for securitized loans. The adoption of these accounting standards,
which we refer to as “consolidation accounting standards,” resulted in the consolidation of substantially all of our
securitization trusts. Prior to our adoption of these new consolidation accounting standards, management
evaluated the company’s performance on a non-GAAP “managed” basis, which assumed that securitized loans
were not sold and the earnings from securitized loans were classified in our results of operations in the same
manner as the earnings from loans that we owned. We believed that our managed basis information is useful to
investors because it portrays the results of both on- and off-balance sheet loans that we manage, which enables
investors to understand and evaluate the credit risks associated with the portfolio of loans reported on our
consolidated balance sheet and our retained interests in securitized loans. Our non-GAAP managed basis
measures may not be comparable to similarly titled measures used by other companies.
As a result of the adoption of these consolidation accounting standards, the accounting for the loans in our
securitization trusts in our reported GAAP financial statements is similar to how we accounted for these loans on
a managed basis prior to January 1, 2010. Consequently, we believe our managed basis presentations for periods
prior to January 1, 2010 are generally comparable to our reported basis presentations for periods beginning after
January 1, 2010. In periods prior to January 1, 2010, certain of our non-GAAP managed basis measures differed
from our comparable reported measures because we assumed, for our managed basis presentation, that
securitized loans that were accounted for as sales in our GAAP financial statements remained on our balance
sheet.
The following tables, which are described below, provide a reconciliation of reported GAAP financial measures
to the non-GAAP managed basis financial measures included in our filing. We also provide the details of the
calculation of certain non-GAAP capital measures that management uses in assessing its capital adequacy.
Page
Table 1: Reconciliation of Financial &
Statistical Summary—Reported GAAP
Measures, Securitization Adjustments and
Non-GAAP Managed Basis Measures
— Reflects selected financial measures from our
consolidated GAAP financial statements or
metrics calculated based on our consolidated
GAAP financial statements to those measures
calculated based on our Non-GAAAP
managed basis results.
2
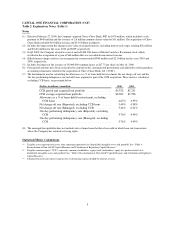
Table 2: Explanatory Notes (Table 1) — Includes explanatory footnotes that provide
additional information for certain financial
and statistical measures presented in Table 1.
3
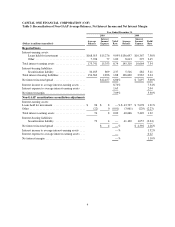
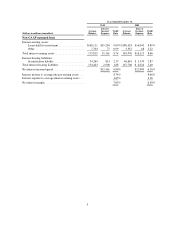
Table 3: Reconciliation of Non-GAAP
Average Balances, Net Interest Income and
Net Interest Margin
— Presents a reconciliation of our average
balances and net interest margin on a reported
basis to our average balances and net interest
margin on a non-GAAP managed basis.
4
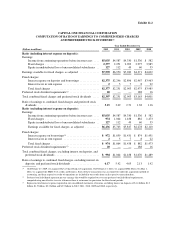
Table 4: Reconciliation of Non-GAAP Capital
Measures and Calculation of Regulatory
Capital Measures
— Presents a reconciliation of our regulatory
capital measures to certain non-GAAP capital
measures.
5
1