Capital One 2012 Annual Report Download - page 118
Download and view the complete annual report
Please find page 118 of the 2012 Capital One annual report below. You can navigate through the pages in the report by either clicking on the pages listed below, or by using the keyword search tool below to find specific information within the annual report.-
 1
1 -
2
-
3
-
4
-
5
-
6
-
7
-
8
-
9
-
10
-
11
-
12
-
13
-
14
-
15
-
16
-
17
-
18
-
19
-
20
-
21
-
22
-
23
-
24
-
25
-
26
-
27
-
28
-
29
-
30
-
31
-
32
-
33
-
34
-
35
-
36
-
37
-
38
-
39
-
40
-
41
-
42
-
43
-
44
-
45
-
46
-
47
-
48
-
49
-
50
-
51
-
52
-
53
-
54
-
55
-
56
-
57
-
58
-
59
-
60
-
61
-
62
-
63
-
64
-
65
-
66
-
67
-
68
-
69
-
70
-
71
-
72
-
73
-
74
-
75
-
76
-
77
-
78
-
79
-
80
-
81
-
82
-
83
-
84
-
85
-
86
-
87
-
88
-
89
-
90
-
91
-
92
-
93
-
94
-
95
-
96
-
97
-
98
-
99
-
100
-
101
-
102
-
103
-
104
-
105
-
106
-
107
-
 108
108 -
 109
109 -
 110
110 -
 111
111 -
 112
112 -
 113
113 -
 114
114 -
 115
115 -
 116
116 -
 117
117 -
 118
118 -
 119
119 -
 120
120 -
 121
121 -
 122
122 -
 123
123 -
 124
124 -
 125
125 -
 126
126 -
 127
127 -
 128
128 -
129
-
130
-
131
-
132
-
133
-
134
-
135
-
136
-
137
-
138
-
139
-
140
-
141
-
142
-
143
-
144
-
145
-
146
-
147
-
148
-
149
-
150
-
151
-
152
-
153
-
154
-
155
-
156
-
157
-
158
-
159
-
160
-
161
-
162
-
163
-
164
-
165
-
166
-
167
-
168
-
169
-
170
-
171
-
172
-
173
-
174
-
175
-
176
-
177
-
178
-
179
-
180
-
181
-
182
-
183
-
184
-
185
-
186
-
187
-
188
-
189
-
190
-
191
-
192
-
193
-
194
-
195
-
196
-
197
-
198
-
199
-
200
-
201
-
202
-
203
-
204
-
205
-
206
-
207
-
208
-
209
-
210
-
211
-
212
-
213
-
214
-
215
-
216
-
217
-
218
-
219
-
220
-
221
-
222
-
223
-
224
-
225
-
226
-
227
-
228
-
229
-
230
-
231
-
232
-
233
-
234
-
235
-
236
-
237
-
238
-
239
-
240
-
241
-
242
-
243
-
244
-
245
-
246
-
247
-
248
-
249
-
250
-
251
-
252
-
253
-
254
-
255
-
256
-
257
-
258
-
259
-
260
-
261
-
262
-
263
-
264
-
265
-
266
-
267
-
268
-
269
-
270
-
271
-
272
-
273
-
274
-
275
-
276
-
277
-
278
-
279
-
280
-
281
-
282
-
283
-
284
-
285
-
286
-
287
-
288
-
289
-
290
-
291
-
292
-
293
-
294
-
295
-
296
-
297
-
298
-
299
-
300
-
301
-
302
-
303
-
304
-
305
-
306
-
307
-
308
-
309
-
310
-
311
 |
 |
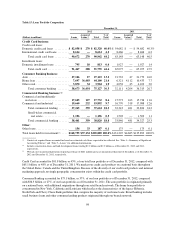
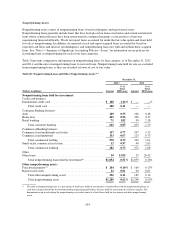
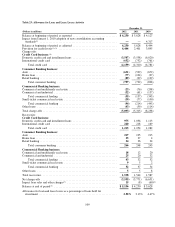
Commercial Banking represented $38.8 billion, or 19%, of our loan portfolio as of December 31, 2012,
compared with $34.3 billion, or 25%, as of December 31, 2011. We operate our Commercial Banking business
primarily in geographic regions where we maintain retail bank branches. Accordingly, the portfolio is
concentrated in New York, Louisiana and Texas, which represent our largest retail banking markets. Our small-
ticket commercial real estate portfolio, which was originated on a national basis through a broker network, is in a
run-off mode.
We provide additional information on the geographic concentration, by loan category, of our loan portfolio in
“Note 5—Loans.”
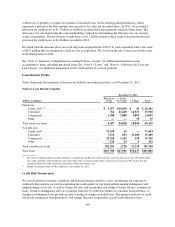
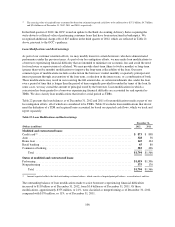
Loans Acquired
As noted above, our portfolio of loans held for investment consists of loans acquired in the Chevy Chase Bank,
ING Direct and 2012 U.S. card acquisitions. These loans were recorded at fair value as of the date of each
acquisition. We elect to account for all purchased loans using the guidance for accounting for purchased credit-
impaired loans, which is based on expected cash flows, unless specifically scoped out of the guidance.
Loans Acquired and Accounted for Based on Expected Cash Flows
We use the term “acquired loans” to refer to a limited portion of the credit card loans acquired in the 2012 U.S.
card acquisition and the substantial majority of consumer and commercial loans acquired in the ING Direct and
Chevy Chase Bank acquisitions, which are accounted for based on expected cash flows to be collected. Acquired
loans accounted for based on expected cash flows to be collected increased to $37.1 billion as of December 31,
2012, from $4.7 billion as of December 31, 2011. The increase was largely due to acquired loans from the ING
Direct acquisition.
We regularly update our estimate of the amount of expected principal and interest to be collected from these
loans and evaluate the results on an aggregated pool basis for loans with common risk characteristics. Probable
decreases in expected loan principal cash flows would trigger the recognition of impairment through our
provision for credit losses. Probable and significant increases in expected cash flows would first reverse any
previously recorded allowance for loan and lease losses established subsequent to acquisition, with any
remaining increase in expected cash flows recognized prospectively in interest income over the remaining
estimated life of the underlying loans. We increased the allowance and recorded a provision for credit losses of
$31 million in 2012 related to certain pools of acquired loans. The cumulative impairment recognized on
acquired loans totaled $57 million and $26 million as of December 31, 2012 and 2011, respectively. The credit
performance of the remaining pools has generally been in line with our expectations, and, in some cases, more
favorable than expected, which has resulted in the reclassification of amounts from the nonaccretable difference
to the accretable yield.
Loans Acquired and Accounted for Based on Contractual Cash Flows
Of the loans acquired in the 2012 U.S. card acquisition, there were loans of $26.2 billion designated as held for
investment that had existing revolving privileges at acquisition and were therefore excluded from the accounting
guidance applied to the acquired loans described in the paragraphs above.
These loans were recorded at a fair value of $26.9 billion, resulting in a net premium of $705 million at
acquisition. Fair value was determined by discounting all expected cash flows (contractual principal, interest,
finance charges and fees of $33.3 billion less those amounts not expected to be collected of $3.0 billion) at a
market discount rate.
Under applicable accounting guidance, we are required to amortize the net premium of $705 million over the
contractual principal amount as an adjustment to interest income over the remaining life of the loans. Given the
guidance applicable to acquired revolving loans, it is necessary to record an allowance through the provision for
99