Capital One 2012 Annual Report Download - page 198
Download and view the complete annual report
Please find page 198 of the 2012 Capital One annual report below. You can navigate through the pages in the report by either clicking on the pages listed below, or by using the keyword search tool below to find specific information within the annual report.-
 1
1 -
2
-
3
-
4
-
5
-
6
-
7
-
8
-
9
-
10
-
11
-
12
-
13
-
14
-
15
-
16
-
17
-
18
-
19
-
20
-
21
-
22
-
23
-
24
-
25
-
26
-
27
-
28
-
29
-
30
-
31
-
32
-
33
-
34
-
35
-
36
-
37
-
38
-
39
-
40
-
41
-
42
-
43
-
44
-
45
-
46
-
47
-
48
-
49
-
50
-
51
-
52
-
53
-
54
-
55
-
56
-
57
-
58
-
59
-
60
-
61
-
62
-
63
-
64
-
65
-
66
-
67
-
68
-
69
-
70
-
71
-
72
-
73
-
74
-
75
-
76
-
77
-
78
-
79
-
80
-
81
-
82
-
83
-
84
-
85
-
86
-
87
-
88
-
89
-
90
-
91
-
92
-
93
-
94
-
95
-
96
-
97
-
98
-
99
-
100
-
101
-
102
-
103
-
104
-
105
-
106
-
107
-
108
-
109
-
110
-
111
-
112
-
113
-
114
-
115
-
116
-
117
-
118
-
119
-
120
-
121
-
122
-
123
-
124
-
125
-
126
-
127
-
128
-
129
-
130
-
131
-
132
-
133
-
134
-
135
-
136
-
137
-
138
-
139
-
140
-
141
-
142
-
143
-
144
-
145
-
146
-
147
-
148
-
149
-
150
-
151
-
152
-
153
-
154
-
155
-
156
-
157
-
158
-
159
-
160
-
161
-
162
-
163
-
164
-
165
-
166
-
167
-
168
-
169
-
170
-
171
-
172
-
173
-
174
-
175
-
176
-
177
-
178
-
179
-
180
-
181
-
182
-
183
-
184
-
185
-
186
-
187
-
 188
188 -
 189
189 -
 190
190 -
 191
191 -
 192
192 -
 193
193 -
 194
194 -
 195
195 -
 196
196 -
 197
197 -
 198
198 -
 199
199 -
 200
200 -
 201
201 -
 202
202 -
 203
203 -
 204
204 -
 205
205 -
 206
206 -
 207
207 -
 208
208 -
209
-
210
-
211
-
212
-
213
-
214
-
215
-
216
-
217
-
218
-
219
-
220
-
221
-
222
-
223
-
224
-
225
-
226
-
227
-
228
-
229
-
230
-
231
-
232
-
233
-
234
-
235
-
236
-
237
-
238
-
239
-
240
-
241
-
242
-
243
-
244
-
245
-
246
-
247
-
248
-
249
-
250
-
251
-
252
-
253
-
254
-
255
-
256
-
257
-
258
-
259
-
260
-
261
-
262
-
263
-
264
-
265
-
266
-
267
-
268
-
269
-
270
-
271
-
272
-
273
-
274
-
275
-
276
-
277
-
278
-
279
-
280
-
281
-
282
-
283
-
284
-
285
-
286
-
287
-
288
-
289
-
290
-
291
-
292
-
293
-
294
-
295
-
296
-
297
-
298
-
299
-
300
-
301
-
302
-
303
-
304
-
305
-
306
-
307
-
308
-
309
-
310
-
311
 |
 |

CAPITAL ONE FINANCIAL CORPORATION
NOTES TO CONSOLIDATED FINANCIAL STATEMENTS—(Continued)
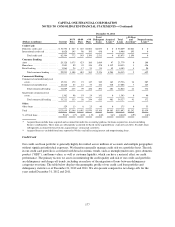
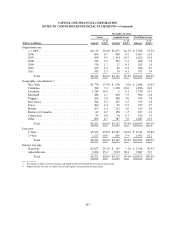
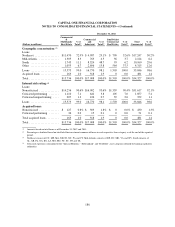
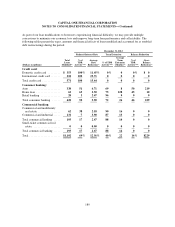
Consumer Banking
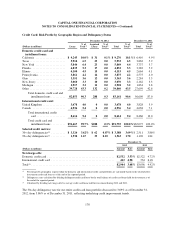
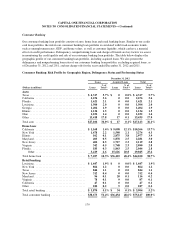
Our consumer banking loan portfolio consists of auto, home loan and retail banking loans. Similar to our credit
card loan portfolio, the risk in our consumer banking loan portfolio is correlated with broad economic trends,
such as unemployment rates, GDP, and home values, as well as customer liquidity, which can have a material
effect on credit performance. Delinquency, nonperforming loans and charge-off trends are key factors we assess
in monitoring the credit quality and risk of our consumer banking loan portfolio. The table below displays the
geographic profile of our consumer banking loan portfolio, including acquired loans. We also present the
delinquency and nonperforming loan rates of our consumer banking loan portfolio, excluding acquired loans, as
of December 31, 2012 and 2011, and net charge-offs for the years ended December 31, 2012 and 2011.
Consumer Banking: Risk Profile by Geographic Region, Delinquency Status and Performing Status
December 31, 2012
Loans Acquired Loans Total
(Dollars in millions) Loans
% of
Total(1) Loans
% of
Total(1) Loans
% of
Total(1)
Auto:
Texas ....................................... $ 4,317 5.7% $ 0 0.0% $ 4,317 5.7%
California ................................... 2,676 3.6 0 0.0 2,676 3.6
Florida ...................................... 1,621 2.1 0 0.0 1,621 2.1
Louisiana .................................... 1,504 2.0 0 0.0 1,504 2.0
Georgia ..................................... 1,404 1.9 0 0.0 1,404 1.9
Illinois ...................................... 1,134 1.5 0 0.0 1,134 1.5
Ohio ....................................... 1,032 1.4 0 0.0 1,032 1.4
Other ....................................... 13,418 17.8 17 0.1 13,435 17.9
Total auto ................................... $27,106 36.0% $ 17 0.1% $27,123 36.1%
Home loan:
California ................................... $ 1,168 1.6% $ 9,098 12.1% $10,266 13.7%
New York ................................... 1,678 2.2 1,598 2.1 3,276 4.3
Illinois ...................................... 102 0.1 2,875 3.8 2,977 3.9
Maryland .................................... 403 0.5 1,878 2.5 2,281 3.0
New Jersey .................................. 402 0.5 1,717 2.3 2,119 2.8
Virginia ..................................... 342 0.5 1,748 2.3 2,090 2.8
Florida ...................................... 183 0.3 1,863 2.5 2,046 2.8
Other ................................... 3,419 4.6 15,626 20.8 19,045 25.4
Total home loan .............................. $ 7,697 10.3% $36,403 48.4% $44,100 58.7%
Retail banking:
Louisiana .................................... $ 1,447 1.9% $ 0 0.0% $ 1,447 1.9%
New York ................................... 864 1.2 0 0.0 864 1.2
Texas ....................................... 844 1.1 0 0.0 844 1.1
New Jersey .................................. 312 0.4 0 0.0 312 0.4
Maryland .................................... 96 0.1 20 0.1 116 0.2
Virginia ..................................... 78 0.1 9 0.0 87 0.1
California ................................... 47 0.1 0 0.0 47 0.1
Other ....................................... 182 0.2 5 0.0 187 0.2
Total retail banking ............................ $ 3,870 5.1% $ 34 0.1% $ 3,904 5.2%
Total consumer banking ........................ $38,673 51.4% $36,454 48.6% $75,127 100.0%
179