Capital One 2011 Annual Report Download - page 99
Download and view the complete annual report
Please find page 99 of the 2011 Capital One annual report below. You can navigate through the pages in the report by either clicking on the pages listed below, or by using the keyword search tool below to find specific information within the annual report.-
 1
1 -
2
-
3
-
4
-
5
-
6
-
7
-
8
-
9
-
10
-
11
-
12
-
13
-
14
-
15
-
16
-
17
-
18
-
19
-
20
-
21
-
22
-
23
-
24
-
25
-
26
-
27
-
28
-
29
-
30
-
31
-
32
-
33
-
34
-
35
-
36
-
37
-
38
-
39
-
40
-
41
-
42
-
43
-
44
-
45
-
46
-
47
-
48
-
49
-
50
-
51
-
52
-
53
-
54
-
55
-
56
-
57
-
58
-
59
-
60
-
61
-
62
-
63
-
64
-
65
-
66
-
67
-
68
-
69
-
70
-
71
-
72
-
73
-
74
-
75
-
76
-
77
-
78
-
79
-
80
-
81
-
82
-
83
-
84
-
85
-
86
-
87
-
88
-
 89
89 -
 90
90 -
 91
91 -
 92
92 -
 93
93 -
 94
94 -
 95
95 -
 96
96 -
 97
97 -
 98
98 -
 99
99 -
 100
100 -
 101
101 -
 102
102 -
 103
103 -
 104
104 -
 105
105 -
 106
106 -
 107
107 -
 108
108 -
 109
109 -
110
-
111
-
112
-
113
-
114
-
115
-
116
-
117
-
118
-
119
-
120
-
121
-
122
-
123
-
124
-
125
-
126
-
127
-
128
-
129
-
130
-
131
-
132
-
133
-
134
-
135
-
136
-
137
-
138
-
139
-
140
-
141
-
142
-
143
-
144
-
145
-
146
-
147
-
148
-
149
-
150
-
151
-
152
-
153
-
154
-
155
-
156
-
157
-
158
-
159
-
160
-
161
-
162
-
163
-
164
-
165
-
166
-
167
-
168
-
169
-
170
-
171
-
172
-
173
-
174
-
175
-
176
-
177
-
178
-
179
-
180
-
181
-
182
-
183
-
184
-
185
-
186
-
187
-
188
-
189
-
190
-
191
-
192
-
193
-
194
-
195
-
196
-
197
-
198
-
199
-
200
-
201
-
202
-
203
-
204
-
205
-
206
-
207
-
208
-
209
-
210
-
211
-
212
-
213
-
214
-
215
-
216
-
217
-
218
-
219
-
220
-
221
-
222
-
223
-
224
-
225
-
226
-
227
-
228
-
229
-
230
-
231
-
232
-
233
-
234
-
235
-
236
-
237
-
238
-
239
-
240
-
241
-
242
-
243
-
244
-
245
-
246
-
247
-
248
-
249
-
250
-
251
-
252
-
253
-
254
-
255
-
256
-
257
-
258
-
259
-
260
-
261
-
262
-
263
-
264
-
265
-
266
-
267
-
268
-
269
-
270
-
271
-
272
-
273
-
274
-
275
-
276
-
277
-
278
-
279
-
280
-
281
-
282
-
283
-
284
-
285
-
286
-
287
-
288
-
289
-
290
-
291
-
292
-
293
-
294
-
295
-
296
-
297
-
298
 |
 |

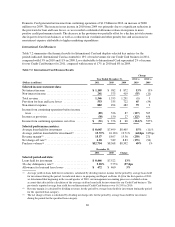
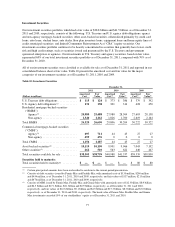
sponsored enterprises or agencies. On August 6, 2011, Standard & Poor’s (“S&P”) downgraded the long-term
sovereign credit rating of the U.S. government from AAA to AA+. This downgrade lowered the credit ratings of
our U.S. Treasury and U.S. Agency securities to AA+. As a result, the percentage of securities in our investment
portfolio with an AAA or equivalent rating fell to 24% as of December 31, 2011, from 92% as of December 31,
2010. If the S&P downgrade had not occurred, the securities in our investment portfolio with an AAA or
equivalent rating would have been approximately 91% as of December 31, 2011. Approximately 4% of our total
investment securities portfolio was below investment grade as of December 31, 2011 and 2010. We categorize
the credit ratings of our investment securities based on the lowest credit rating as issued by the rating agencies
S&P, Moody’s Investors Service (“Moody’s”), Fitch Ratings (“Fitch”) and Dominion Bond Rating Services
(“DBRS”).
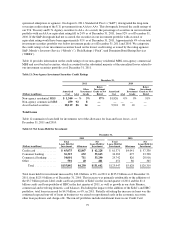
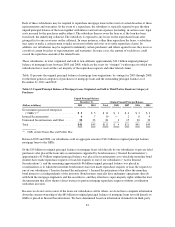
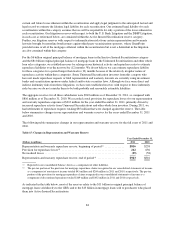
Table 11 provides information on the credit ratings of our non-agency residential MBS, non-agency commercial
MBS and asset-backed securities, which accounted for the substantial majority of the unrealized losses related to
our investment securities portfolio as of December 31, 2011.
Table 11: Non-Agency Investment Securities Credit Ratings
December 31,
2011 2010
(Dollars in millions)
Amortized
Cost AAA
Other
Investment
Grade
Below
Investment
Grade or Not
Rated
Amortized
Cost AAA
Other
Investment
Grade
Below
Investment
Grade or Not
Rated
Non-agency residential MBS . . . $ 1,340 — % 3% 97% $1,826 0% 9% 91%
Non-agency commercial MBS . . 459 92 8 — —— — —
Asset-backed securities ........ 10,119 86 14 — 9,901 90 10
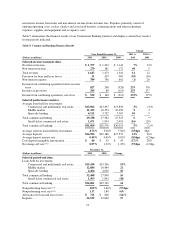
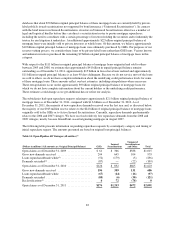
Total Loans
Table 12 summarizes loans held for investment, net of the allowance for loan and lease losses, as of
December 31, 2011 and 2010.
Table 12: Net Loans Held for Investment
December 31,
2011 2010
(Dollars in millions)
Total
Loans Held for
Investment Allowance
Net
Loans Held for
Investment
Total
Loans Held for
Investment Allowance
Net
Loans Held for
Investment
Credit card .............. $ 65,075 $2,847 $ 62,228 $ 61,371 $4,041 $ 57,330
Consumer banking ........ 36,315 652 35,663 34,383 675 33,708
Commercial banking ...... 34,001 711 33,290 29,742 826 28,916
Other ................... 501 40 461 451 86 365
Total ............... $135,892 $4,250 $131,642 $125,947 $5,628 $120,319
Total loans held for investment increased by $10.0 billion, or 8%, in 2011 to $135.9 billion as of December 31,
2011, from $125.9 billion as of December 31, 2010. This increase was primarily attributable to the additions of
the $3.7 billion private-label credit card loan portfolio of Kohl’s in the second quarter of 2011 and the $1.4
billion credit card loan portfolio of HBC in the first quarter of 2011, as well as growth in our Auto Finance,
commercial and revolving domestic card balances. Excluding the impact of the addition of the Kohl’s and HBC
portfolios, total loans increased by $4.9 billion, or 4%, in 2011. Partially offsetting the increase in loans was the
continued expected run-off of loans in businesses we exited or repositioned early in the economic recession,
other loan paydowns and charge-offs. The run-off portfolios include installment loans in our Credit Card
79
—