Capital One 2011 Annual Report Download - page 106
Download and view the complete annual report
Please find page 106 of the 2011 Capital One annual report below. You can navigate through the pages in the report by either clicking on the pages listed below, or by using the keyword search tool below to find specific information within the annual report.-
 1
1 -
2
-
3
-
4
-
5
-
6
-
7
-
8
-
9
-
10
-
11
-
12
-
13
-
14
-
15
-
16
-
17
-
18
-
19
-
20
-
21
-
22
-
23
-
24
-
25
-
26
-
27
-
28
-
29
-
30
-
31
-
32
-
33
-
34
-
35
-
36
-
37
-
38
-
39
-
40
-
41
-
42
-
43
-
44
-
45
-
46
-
47
-
48
-
49
-
50
-
51
-
52
-
53
-
54
-
55
-
56
-
57
-
58
-
59
-
60
-
61
-
62
-
63
-
64
-
65
-
66
-
67
-
68
-
69
-
70
-
71
-
72
-
73
-
74
-
75
-
76
-
77
-
78
-
79
-
80
-
81
-
82
-
83
-
84
-
85
-
86
-
87
-
88
-
89
-
90
-
91
-
92
-
93
-
94
-
95
-
 96
96 -
 97
97 -
 98
98 -
 99
99 -
 100
100 -
 101
101 -
 102
102 -
 103
103 -
 104
104 -
 105
105 -
 106
106 -
 107
107 -
 108
108 -
 109
109 -
 110
110 -
 111
111 -
 112
112 -
 113
113 -
 114
114 -
 115
115 -
 116
116 -
117
-
118
-
119
-
120
-
121
-
122
-
123
-
124
-
125
-
126
-
127
-
128
-
129
-
130
-
131
-
132
-
133
-
134
-
135
-
136
-
137
-
138
-
139
-
140
-
141
-
142
-
143
-
144
-
145
-
146
-
147
-
148
-
149
-
150
-
151
-
152
-
153
-
154
-
155
-
156
-
157
-
158
-
159
-
160
-
161
-
162
-
163
-
164
-
165
-
166
-
167
-
168
-
169
-
170
-
171
-
172
-
173
-
174
-
175
-
176
-
177
-
178
-
179
-
180
-
181
-
182
-
183
-
184
-
185
-
186
-
187
-
188
-
189
-
190
-
191
-
192
-
193
-
194
-
195
-
196
-
197
-
198
-
199
-
200
-
201
-
202
-
203
-
204
-
205
-
206
-
207
-
208
-
209
-
210
-
211
-
212
-
213
-
214
-
215
-
216
-
217
-
218
-
219
-
220
-
221
-
222
-
223
-
224
-
225
-
226
-
227
-
228
-
229
-
230
-
231
-
232
-
233
-
234
-
235
-
236
-
237
-
238
-
239
-
240
-
241
-
242
-
243
-
244
-
245
-
246
-
247
-
248
-
249
-
250
-
251
-
252
-
253
-
254
-
255
-
256
-
257
-
258
-
259
-
260
-
261
-
262
-
263
-
264
-
265
-
266
-
267
-
268
-
269
-
270
-
271
-
272
-
273
-
274
-
275
-
276
-
277
-
278
-
279
-
280
-
281
-
282
-
283
-
284
-
285
-
286
-
287
-
288
-
289
-
290
-
291
-
292
-
293
-
294
-
295
-
296
-
297
-
298
 |
 |

for our securitization trusts. The adoption of these new consolidation accounting standards resulted in the
consolidation of substantially all of our securitization trusts.
Our continuing involvement in unconsolidated VIEs primarily consists of certain mortgage loan trusts and
community reinvestment and development entities. The carrying amount of assets and liabilities of these
unconsolidated VIEs was $2.3 billion and $319 million, respectively, as of December 31, 2011, and our
maximum exposure to loss was $2.5 billion. We provide a discussion of our activities related to these VIEs in
“Note 7—Variable Interest Entities and Securitizations.”
CAPITAL MANAGEMENT
The level and composition of our equity capital are determined by multiple factors, including our consolidated
regulatory capital requirements and an internal risk-based capital assessment, and may also be influenced by
rating agency guidelines, subsidiary capital requirements, the business environment, conditions in the financial
markets and assessments of potential future losses due to adverse changes in our business and market
environments.
Capital Standards and Prompt Corrective Action
Bank holding companies and national banks are subject to capital adequacy standards adopted by the Federal
Reserve and the OCC, respectively. The capital adequacy standards set forth minimum risk-based and leverage
capital requirements that are based on quantitative and qualitative measures of their assets and off-balance sheet
items. Under the capital adequacy standards, bank holding companies and banks currently are required to
maintain a total risk-based capital ratio of at least 8%, a Tier 1 risk-based capital ratio of at least 4%, and a Tier 1
leverage capital ratio of at least 4% (3% for banks that meet certain specified criteria, including excellent asset
quality, high liquidity, low interest rate exposure and the highest regulatory rating) in order to be considered
adequately capitalized.
National banks also are subject to prompt corrective action capital regulations. Under prompt corrective action
regulations, a bank is considered to be well capitalized if it maintains a Tier 1 risk-based capital ratio of at least
6% (200 basis points higher than the above minimum capital standard), a total risk-based capital ratio of at least
10% (200 basis points higher than the above minimum capital standard), a Tier 1 leverage capital ratio of at least
5% and is not subject to any supervisory agreement, order or directive to meet and maintain a specific capital
level for any capital reserve. A bank is considered to be adequately capitalized if it meets these minimum capital
ratios and does not otherwise meet the well capitalized definition. Currently, prompt corrective action capital
requirements do not apply to bank holding companies.
In addition to disclosing our regulatory capital ratios, we also disclose Tier 1 common equity and TCE ratios,
which are non-GAAP measures widely used by investors, analysts, rating agencies and bank regulatory agencies
to assess the capital position of financial services companies. There is currently no mandated minimum or “well
capitalized” standard for Tier 1 common equity; instead the risk-based capital rules state that voting common
stockholders’ equity should be the dominant element within Tier 1 common equity. While these non-GAAP
capital measures are widely used by investors, analysts and bank regulatory agencies to assess the capital
position of financial services companies, they may not be comparable to similarly titled measures reported by
other companies. We provide information on the calculation of these ratios and non-GAAP reconciliation in
“Supplemental Tables” below.
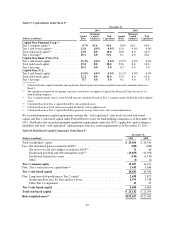
Table 17 provides a comparison of our capital ratios under the Federal Reserve’s capital adequacy standards; and
the capital ratios of the Banks under the OCC’s capital adequacy standards as of December 31, 2011 and 2010.
Table 18 provides the details of the calculation of our capital ratios.
86