Capital One 2011 Annual Report Download - page 91
Download and view the complete annual report
Please find page 91 of the 2011 Capital One annual report below. You can navigate through the pages in the report by either clicking on the pages listed below, or by using the keyword search tool below to find specific information within the annual report.-
 1
1 -
2
-
3
-
4
-
5
-
6
-
7
-
8
-
9
-
10
-
11
-
12
-
13
-
14
-
15
-
16
-
17
-
18
-
19
-
20
-
21
-
22
-
23
-
24
-
25
-
26
-
27
-
28
-
29
-
30
-
31
-
32
-
33
-
34
-
35
-
36
-
37
-
38
-
39
-
40
-
41
-
42
-
43
-
44
-
45
-
46
-
47
-
48
-
49
-
50
-
51
-
52
-
53
-
54
-
55
-
56
-
57
-
58
-
59
-
60
-
61
-
62
-
63
-
64
-
65
-
66
-
67
-
68
-
69
-
70
-
71
-
72
-
73
-
74
-
75
-
76
-
77
-
78
-
79
-
80
-
 81
81 -
 82
82 -
 83
83 -
 84
84 -
 85
85 -
 86
86 -
 87
87 -
 88
88 -
 89
89 -
 90
90 -
 91
91 -
 92
92 -
 93
93 -
 94
94 -
 95
95 -
 96
96 -
 97
97 -
 98
98 -
 99
99 -
 100
100 -
 101
101 -
102
-
103
-
104
-
105
-
106
-
107
-
108
-
109
-
110
-
111
-
112
-
113
-
114
-
115
-
116
-
117
-
118
-
119
-
120
-
121
-
122
-
123
-
124
-
125
-
126
-
127
-
128
-
129
-
130
-
131
-
132
-
133
-
134
-
135
-
136
-
137
-
138
-
139
-
140
-
141
-
142
-
143
-
144
-
145
-
146
-
147
-
148
-
149
-
150
-
151
-
152
-
153
-
154
-
155
-
156
-
157
-
158
-
159
-
160
-
161
-
162
-
163
-
164
-
165
-
166
-
167
-
168
-
169
-
170
-
171
-
172
-
173
-
174
-
175
-
176
-
177
-
178
-
179
-
180
-
181
-
182
-
183
-
184
-
185
-
186
-
187
-
188
-
189
-
190
-
191
-
192
-
193
-
194
-
195
-
196
-
197
-
198
-
199
-
200
-
201
-
202
-
203
-
204
-
205
-
206
-
207
-
208
-
209
-
210
-
211
-
212
-
213
-
214
-
215
-
216
-
217
-
218
-
219
-
220
-
221
-
222
-
223
-
224
-
225
-
226
-
227
-
228
-
229
-
230
-
231
-
232
-
233
-
234
-
235
-
236
-
237
-
238
-
239
-
240
-
241
-
242
-
243
-
244
-
245
-
246
-
247
-
248
-
249
-
250
-
251
-
252
-
253
-
254
-
255
-
256
-
257
-
258
-
259
-
260
-
261
-
262
-
263
-
264
-
265
-
266
-
267
-
268
-
269
-
270
-
271
-
272
-
273
-
274
-
275
-
276
-
277
-
278
-
279
-
280
-
281
-
282
-
283
-
284
-
285
-
286
-
287
-
288
-
289
-
290
-
291
-
292
-
293
-
294
-
295
-
296
-
297
-
298
 |
 |

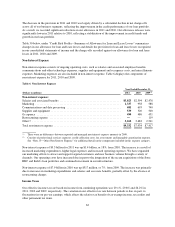
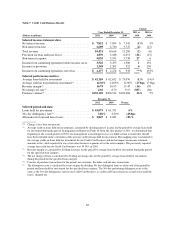
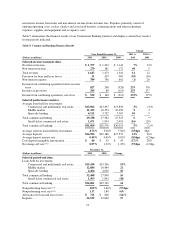
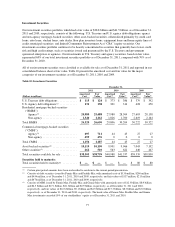
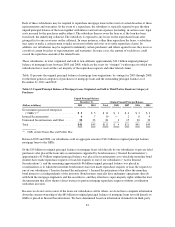
Table 8: Consumer Banking Business Results
Change
Year Ended December 31, 2011 vs. 2010 vs.
(Dollars in millions) 2011 2010 2009 2010 2009
Selected income statement data:
Net interest income ............................ $ 4,236 $ 3,727 $ 3,231 14% 15%
Non-interest income ........................... 720 870 755 (17) 15
Total revenue ................................. 4,956 4,597 3,986 815
Provision for loan and lease losses ................ 452 241 876 88 (72)
Non-interest expense ........................... 3,244 2,950 2,734 10 8
Income from continuing operations before income taxes 1,260 1,406 376 (10) 274
Income tax provision ........................... 451 501 132 (10) 280
Income from continuing operations, net of tax ....... $ 809 $ 905 $ 244 (11)% 271%
Selected performance metrics:
Average loans held for investment:
Auto .................................... $19,419 $17,551 $19,950 11% (12)%
Home loan ............................... 11,322 13,629 14,434 (17) (6)
Retail banking ............................ 4,097 4,745 5,490 (14) (14)
Total consumer banking ........................ $34,838 $35,925 $39,874 (3)% (10)%
Average yield on loans held for investment ......... 9.60% 9.11% 8.94% 49bps 17bps
Average deposits .............................. $86,883 $78,083 $70,862 11% 10%
Average deposit interest rate ..................... 0.96% 1.19% 1.68% (23)bps (49)bps
Core deposit intangible amortization ............... $ 132 $ 144 $ 169 (8)% (15)%
Net charge-off rate(1)(2) .......................... 1.39% 1.82% 2.74% (43)bps (92)bps
Auto loan originations .......................... $12,476 $ 7,764 $ 5,336 61% 46%
December 31,
2011 2010 Change
Selected period-end data:
Loans held for investment:
Auto .................................... $21,779 $17,867 22%
Home loan ............................... 10,433 12,103 (14)
Retail banking ............................ 4,103 4,413 (7)
Total consumer banking ........................ $36,315 $34,383 6%
30+ day performing delinquency rate(1)(3) ........... 4.47% 4.28% 19bps
30+ day delinquency rate(1)(3) ..................... 5.99 5.96 3
Nonperforming loan rate(1)(4) ..................... 1.79 1.97 (18)
Nonperforming asset rate(1)(5) .................... 1.94 2.17 (23)
Allowance for loan and lease losses ............... $ 652 $ 675 (3)%
Deposits ..................................... 88,540 82,959 7
Loans serviced for others ........................ 17,998 20,689 (13)
(1) Average loans held for investment used in the denominator in calculating net charge-off, delinquency and nonperforming
loan and nonperforming asset rates includes the impact of loans acquired as part of the Chevy Chase Bank acquisition,
which were considered purchased credit-impaired (“PCI”) loans. However, we separately track and report PCI loans and
exclude these loans from our net charge-off, delinquency, nonperforming loan and nonperforming asset rates.
(2) The net charge-off rate is calculated by loan category by dividing net charge-offs for the period by average loans held for
investment during the period for the specified loan category. The net charge-off rate, excluding loans acquired from
Chevy Chase Bank from the denominator, was 1.60%, 2.16% and 3.17% in 2011, 2010 and 2009, respectively.
71