Capital One 2011 Annual Report Download - page 139
Download and view the complete annual report
Please find page 139 of the 2011 Capital One annual report below. You can navigate through the pages in the report by either clicking on the pages listed below, or by using the keyword search tool below to find specific information within the annual report.-
 1
1 -
2
-
3
-
4
-
5
-
6
-
7
-
8
-
9
-
10
-
11
-
12
-
13
-
14
-
15
-
16
-
17
-
18
-
19
-
20
-
21
-
22
-
23
-
24
-
25
-
26
-
27
-
28
-
29
-
30
-
31
-
32
-
33
-
34
-
35
-
36
-
37
-
38
-
39
-
40
-
41
-
42
-
43
-
44
-
45
-
46
-
47
-
48
-
49
-
50
-
51
-
52
-
53
-
54
-
55
-
56
-
57
-
58
-
59
-
60
-
61
-
62
-
63
-
64
-
65
-
66
-
67
-
68
-
69
-
70
-
71
-
72
-
73
-
74
-
75
-
76
-
77
-
78
-
79
-
80
-
81
-
82
-
83
-
84
-
85
-
86
-
87
-
88
-
89
-
90
-
91
-
92
-
93
-
94
-
95
-
96
-
97
-
98
-
99
-
100
-
101
-
102
-
103
-
104
-
105
-
106
-
107
-
108
-
109
-
110
-
111
-
112
-
113
-
114
-
115
-
116
-
117
-
118
-
119
-
120
-
121
-
122
-
123
-
124
-
125
-
126
-
127
-
128
-
 129
129 -
 130
130 -
 131
131 -
 132
132 -
 133
133 -
 134
134 -
 135
135 -
 136
136 -
 137
137 -
 138
138 -
 139
139 -
 140
140 -
 141
141 -
 142
142 -
 143
143 -
 144
144 -
 145
145 -
 146
146 -
 147
147 -
 148
148 -
 149
149 -
150
-
151
-
152
-
153
-
154
-
155
-
156
-
157
-
158
-
159
-
160
-
161
-
162
-
163
-
164
-
165
-
166
-
167
-
168
-
169
-
170
-
171
-
172
-
173
-
174
-
175
-
176
-
177
-
178
-
179
-
180
-
181
-
182
-
183
-
184
-
185
-
186
-
187
-
188
-
189
-
190
-
191
-
192
-
193
-
194
-
195
-
196
-
197
-
198
-
199
-
200
-
201
-
202
-
203
-
204
-
205
-
206
-
207
-
208
-
209
-
210
-
211
-
212
-
213
-
214
-
215
-
216
-
217
-
218
-
219
-
220
-
221
-
222
-
223
-
224
-
225
-
226
-
227
-
228
-
229
-
230
-
231
-
232
-
233
-
234
-
235
-
236
-
237
-
238
-
239
-
240
-
241
-
242
-
243
-
244
-
245
-
246
-
247
-
248
-
249
-
250
-
251
-
252
-
253
-
254
-
255
-
256
-
257
-
258
-
259
-
260
-
261
-
262
-
263
-
264
-
265
-
266
-
267
-
268
-
269
-
270
-
271
-
272
-
273
-
274
-
275
-
276
-
277
-
278
-
279
-
280
-
281
-
282
-
283
-
284
-
285
-
286
-
287
-
288
-
289
-
290
-
291
-
292
-
293
-
294
-
295
-
296
-
297
-
298
 |
 |

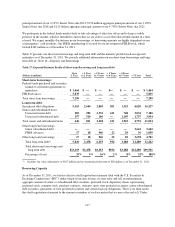
acquisition/license commitments, contractual minimum media commitments and any contractually required cash
payments for acquisitions.
(4) Excludes funding commitments entered into in the ordinary course of business. See “Note 21—Commitments,
Contingencies and Guarantees” for further details.
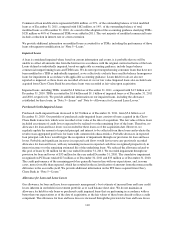
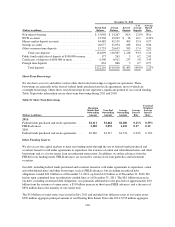
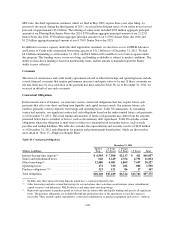
Credit Ratings
Our credit ratings have a significant impact on our ability to access capital markets and our borrowing costs.
Rating agencies base their ratings on numerous factors, including liquidity, capital adequacy, asset quality,
quality of earnings and the probability of systemic support. Significant changes in these factors could result in
different ratings. Our equity capital and funding strategies are designed, among other things, to maintain
appropriate and stable unsecured debt ratings from the major credit ratings agencies, Moody’s, S&P, Fitch and
DBRS. Such ratings help to support our cost effective unsecured funding as part of our overall financing
programs. Table 39 provides a summary of the credit ratings for the senior unsecured debt of Capital One
Financial Corporation, COBNA and CONA as of December 31, 2011, and as of the date of this Report.
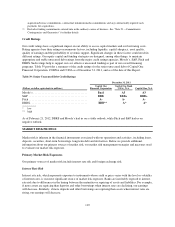
Table 39: Senior Unsecured Debt Credit Ratings
December 31, 2011
(Dollars or dollar equivalents in millions)
Capital One
Financial Corporation
Capital One Bank
(USA), N.A. Capital One, N.A.
Moody’s ...................................... Baa1 A3 A3
S&P ......................................... BBB BBB+ BBB+
Fitch ......................................... A- A- A-
DBRS ........................................ BBB** A* A*
* low
** high
As of February 21, 2012, DBRS and Moody’s had us on a stable outlook, while Fitch and S&P had us on
negative outlook.
MARKET RISK PROFILE
Market risk is inherent in the financial instruments associated with our operations and activities, including loans,
deposits, securities, short-term borrowings, long-term debt and derivatives. Below we provide additional
information about our primary sources of market risk, our market risk management strategies and measures used
to evaluate our market risk exposure.
Primary Market Risk Exposures
Our primary sources of market risk include interest rate risk and foreign exchange risk.
Interest Rate Risk
Interest rate risk, which represents exposure to instruments whose yield or price varies with the level or volatility
of interest rates, is our most significant source of market risk exposure. Banks are inevitably exposed to interest
rate risk due to differences in the timing between the maturities or repricing of assets and liabilities. For example,
if more assets are repricing than deposits and other borrowings when interest rates are declining, our earnings
will decrease. Similarly, if more deposits and other borrowings are repricing than assets when interest rates are
rising, our earnings will decrease.
119