Capital One 2011 Annual Report Download - page 192
Download and view the complete annual report
Please find page 192 of the 2011 Capital One annual report below. You can navigate through the pages in the report by either clicking on the pages listed below, or by using the keyword search tool below to find specific information within the annual report.-
 1
1 -
2
-
3
-
4
-
5
-
6
-
7
-
8
-
9
-
10
-
11
-
12
-
13
-
14
-
15
-
16
-
17
-
18
-
19
-
20
-
21
-
22
-
23
-
24
-
25
-
26
-
27
-
28
-
29
-
30
-
31
-
32
-
33
-
34
-
35
-
36
-
37
-
38
-
39
-
40
-
41
-
42
-
43
-
44
-
45
-
46
-
47
-
48
-
49
-
50
-
51
-
52
-
53
-
54
-
55
-
56
-
57
-
58
-
59
-
60
-
61
-
62
-
63
-
64
-
65
-
66
-
67
-
68
-
69
-
70
-
71
-
72
-
73
-
74
-
75
-
76
-
77
-
78
-
79
-
80
-
81
-
82
-
83
-
84
-
85
-
86
-
87
-
88
-
89
-
90
-
91
-
92
-
93
-
94
-
95
-
96
-
97
-
98
-
99
-
100
-
101
-
102
-
103
-
104
-
105
-
106
-
107
-
108
-
109
-
110
-
111
-
112
-
113
-
114
-
115
-
116
-
117
-
118
-
119
-
120
-
121
-
122
-
123
-
124
-
125
-
126
-
127
-
128
-
129
-
130
-
131
-
132
-
133
-
134
-
135
-
136
-
137
-
138
-
139
-
140
-
141
-
142
-
143
-
144
-
145
-
146
-
147
-
148
-
149
-
150
-
151
-
152
-
153
-
154
-
155
-
156
-
157
-
158
-
159
-
160
-
161
-
162
-
163
-
164
-
165
-
166
-
167
-
168
-
169
-
170
-
171
-
172
-
173
-
174
-
175
-
176
-
177
-
178
-
179
-
180
-
181
-
 182
182 -
 183
183 -
 184
184 -
 185
185 -
 186
186 -
 187
187 -
 188
188 -
 189
189 -
 190
190 -
 191
191 -
 192
192 -
 193
193 -
 194
194 -
 195
195 -
 196
196 -
 197
197 -
 198
198 -
 199
199 -
 200
200 -
 201
201 -
 202
202 -
203
-
204
-
205
-
206
-
207
-
208
-
209
-
210
-
211
-
212
-
213
-
214
-
215
-
216
-
217
-
218
-
219
-
220
-
221
-
222
-
223
-
224
-
225
-
226
-
227
-
228
-
229
-
230
-
231
-
232
-
233
-
234
-
235
-
236
-
237
-
238
-
239
-
240
-
241
-
242
-
243
-
244
-
245
-
246
-
247
-
248
-
249
-
250
-
251
-
252
-
253
-
254
-
255
-
256
-
257
-
258
-
259
-
260
-
261
-
262
-
263
-
264
-
265
-
266
-
267
-
268
-
269
-
270
-
271
-
272
-
273
-
274
-
275
-
276
-
277
-
278
-
279
-
280
-
281
-
282
-
283
-
284
-
285
-
286
-
287
-
288
-
289
-
290
-
291
-
292
-
293
-
294
-
295
-
296
-
297
-
298
 |
 |

CAPITAL ONE FINANCIAL CORPORATION
NOTES TO CONSOLIDATED STATEMENTS—(Continued)
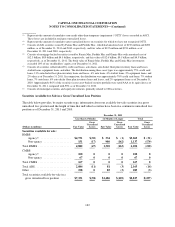
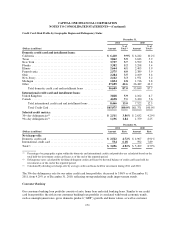
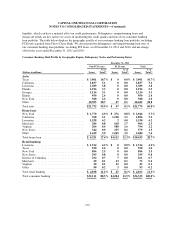
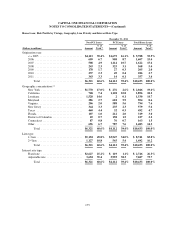
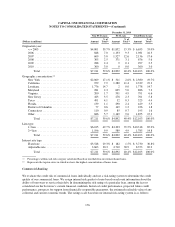
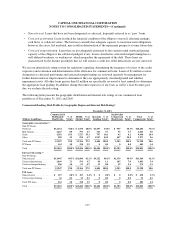
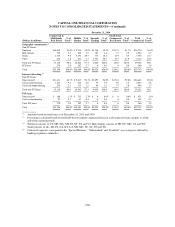
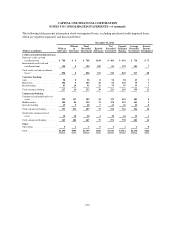
liquidity, which can have a material effect on credit performance. Delinquency, nonperforming loans and
charge-off trends are key factors we assess in monitoring the credit quality and risk of our consumer banking
loan portfolio. The table below displays the geographic profile of our consumer banking loan portfolio, including
PCI loans acquired from Chevy Chase Bank. We also present the delinquency and nonperforming loan rates of
our consumer banking loan portfolio, excluding PCI loans, as of December 31, 2011 and 2010, and net-charge
offs for the years ended December 31, 2011 and 2010.
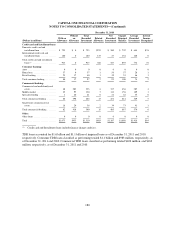
Consumer Banking: Risk Profile by Geographic Region, Delinquency Status and Performing Status
December 31, 2011
Non-PCI Loans PCI Loans Total
(Dollars in millions) Loans
% of
Total(1) Loans
% of
Total(1) Loans
% of
Total(1)
Auto:
Texas ...................................... $ 3,901 10.7% $ 0 0.0% $ 3,901 10.7%
California ................................... 1,837 5.1 0 0.0 1,837 5.1
Louisiana ................................... 1,389 3.8 0 0.0 1,389 3.8
Florida ..................................... 1,196 3.3 0 0.0 1,196 3.3
Georgia .................................... 1,124 3.1 0 0.0 1,124 3.1
Illinois ..................................... 950 2.6 0 0.0 950 2.6
New York .................................. 940 2.6 0 0.0 940 2.6
Other ...................................... 10,395 28.7 47 0.1 10,442 28.8
Total auto ................................... $21,732 59.9% $ 47 0.1% $21,779 60.0%
Home loan:
New York .................................. $ 1,770 4.9% $ 276 0.8% $ 2,046 5.7%
California ................................... 768 2.1 1,128 3.1 1,896 5.2
Louisiana ................................... 1,528 4.2 2 0.0 1,530 4.2
Maryland ................................... 286 0.8 618 1.7 904 2.5
Virginia .................................... 206 0.6 588 1.6 794 2.2
New Jersey .................................. 344 0.9 235 0.6 579 1.5
Other ...................................... 1,419 3.9 1,265 3.5 2,684 7.4
Total home loan .............................. $ 6,321 17.4% $4,112 11.3% $10,433 28.7%
Retail banking:
Louisiana ................................... $ 1,514 4.2% $ 0 0.0% $ 1,514 4.2%
Texas ...................................... 930 2.6 0 0.0 930 2.6
New York .................................. 896 2.5 0 0.0 896 2.5
New Jersey .................................. 295 0.8 0 0.0 295 0.8
District of Columbia .......................... 254 0.7 7 0.0 261 0.7
Maryland ................................... 49 0.1 23 0.1 72 0.2
Virginia .................................... 30 0.1 12 0.0 42 0.1
Other ...................................... 90 0.2 3 0.0 93 0.2
Total retail banking ........................... $ 4,058 11.2% $ 45 0.1% $ 4,103 11.3%
Total consumer banking ....................... $32,111 88.5% $4,204 11.5% $36,315 100.0%
172