Capital One 2011 Annual Report Download - page 155
Download and view the complete annual report
Please find page 155 of the 2011 Capital One annual report below. You can navigate through the pages in the report by either clicking on the pages listed below, or by using the keyword search tool below to find specific information within the annual report.-
 1
1 -
2
-
3
-
4
-
5
-
6
-
7
-
8
-
9
-
10
-
11
-
12
-
13
-
14
-
15
-
16
-
17
-
18
-
19
-
20
-
21
-
22
-
23
-
24
-
25
-
26
-
27
-
28
-
29
-
30
-
31
-
32
-
33
-
34
-
35
-
36
-
37
-
38
-
39
-
40
-
41
-
42
-
43
-
44
-
45
-
46
-
47
-
48
-
49
-
50
-
51
-
52
-
53
-
54
-
55
-
56
-
57
-
58
-
59
-
60
-
61
-
62
-
63
-
64
-
65
-
66
-
67
-
68
-
69
-
70
-
71
-
72
-
73
-
74
-
75
-
76
-
77
-
78
-
79
-
80
-
81
-
82
-
83
-
84
-
85
-
86
-
87
-
88
-
89
-
90
-
91
-
92
-
93
-
94
-
95
-
96
-
97
-
98
-
99
-
100
-
101
-
102
-
103
-
104
-
105
-
106
-
107
-
108
-
109
-
110
-
111
-
112
-
113
-
114
-
115
-
116
-
117
-
118
-
119
-
120
-
121
-
122
-
123
-
124
-
125
-
126
-
127
-
128
-
129
-
130
-
131
-
132
-
133
-
134
-
135
-
136
-
137
-
138
-
139
-
140
-
141
-
142
-
143
-
144
-
 145
145 -
 146
146 -
 147
147 -
 148
148 -
 149
149 -
 150
150 -
 151
151 -
 152
152 -
 153
153 -
 154
154 -
 155
155 -
 156
156 -
 157
157 -
 158
158 -
 159
159 -
 160
160 -
 161
161 -
 162
162 -
 163
163 -
 164
164 -
 165
165 -
166
-
167
-
168
-
169
-
170
-
171
-
172
-
173
-
174
-
175
-
176
-
177
-
178
-
179
-
180
-
181
-
182
-
183
-
184
-
185
-
186
-
187
-
188
-
189
-
190
-
191
-
192
-
193
-
194
-
195
-
196
-
197
-
198
-
199
-
200
-
201
-
202
-
203
-
204
-
205
-
206
-
207
-
208
-
209
-
210
-
211
-
212
-
213
-
214
-
215
-
216
-
217
-
218
-
219
-
220
-
221
-
222
-
223
-
224
-
225
-
226
-
227
-
228
-
229
-
230
-
231
-
232
-
233
-
234
-
235
-
236
-
237
-
238
-
239
-
240
-
241
-
242
-
243
-
244
-
245
-
246
-
247
-
248
-
249
-
250
-
251
-
252
-
253
-
254
-
255
-
256
-
257
-
258
-
259
-
260
-
261
-
262
-
263
-
264
-
265
-
266
-
267
-
268
-
269
-
270
-
271
-
272
-
273
-
274
-
275
-
276
-
277
-
278
-
279
-
280
-
281
-
282
-
283
-
284
-
285
-
286
-
287
-
288
-
289
-
290
-
291
-
292
-
293
-
294
-
295
-
296
-
297
-
298
 |
 |

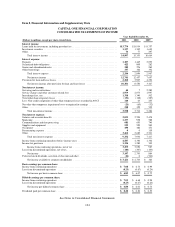
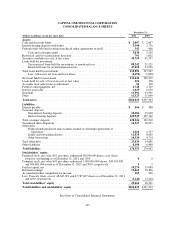
CAPITAL ONE FINANCIAL CORPORATION
CONSOLIDATED BALANCE SHEETS
December 31,
(Dollars in millions, except per share data) 2011 2010
Assets:
Cash and due from banks ................................................... $ 2,097 $ 2,067
Interest-bearing deposits with banks ........................................... 3,399 2,776
Federal funds sold and securities purchased under agreements to resell ............... 342 406
Cash and cash equivalents ............................................... 5,838 5,249
Restricted cash for securitization investors ...................................... 791 1,602
Securities available for sale, at fair value ....................................... 38,759 41,537
Loans held for investment:
Unsecuritized loans held for investment, at amortized cost ..................... 88,242 71,921
Restricted loans for securitization investors ................................. 47,650 54,026
Total loans held for investment ............................................... 135,892 125,947
Less: Allowance for loan and lease losses .................................. (4,250) (5,628)
Net loans held for investment ................................................ 131,642 120,319
Loans held for sale, at lower-of-cost-or-fair value ................................ 201 228
Accounts receivable from securitizations ....................................... 94 118
Premises and equipment, net ................................................. 2,748 2,749
Interest receivable ......................................................... 1,029 1,070
Goodwill ................................................................ 13,592 13,591
Other ................................................................... 11,325 11,040
Total assets .............................................................. $206,019 $197,503
Liabilities:
Interest payable ........................................................... $ 466 $ 488
Customer deposits:
Non-interest bearing deposits ............................................ 18,281 15,048
Interest bearing deposits ................................................ 109,945 107,162
Total customer deposits ..................................................... 128,226 122,210
Securitized debt obligations ................................................. 16,527 26,915
Other debt:
Federal funds purchased and securities loaned or sold under agreements to
repurchase ......................................................... 1,464 1,517
Senior and subordinated notes ............................................ 11,034 8,650
Other borrowings ...................................................... 10,536 4,714
Total other debt ........................................................... 23,034 14,881
Other liabilities ........................................................... 8,100 6,468
Total liabilities ........................................................... 176,353 170,962
Stockholders’ equity:
Preferred stock, par value $.01 per share; authorized 50,000,000 shares; zero shares
issued or outstanding as of December 31, 2011 and 2010 ........................ 00
Common stock, par value $.01 per share; authorized 1,000,000,000 shares; 508,594,308
and 504,801,064 issued as of December 31, 2011 and 2010, respectively ............ 55
Paid-in capital, net ......................................................... 19,274 19,084
Retained earnings ......................................................... 13,462 10,406
Accumulated other comprehensive income ..................................... 169 248
Less: Treasury stock, at cost; 48,647,091 and 47,787,697 shares as of December 31, 2011
and 2010, respectively .................................................... (3,244) (3,202)
Total stockholders’ equity ................................................. 29,666 26,541
Total liabilities and stockholders’ equity ..................................... $206,019 $197,503
See Notes to Consolidated Financial Statements.
135