Capital One 2011 Annual Report Download - page 105
Download and view the complete annual report
Please find page 105 of the 2011 Capital One annual report below. You can navigate through the pages in the report by either clicking on the pages listed below, or by using the keyword search tool below to find specific information within the annual report.-
 1
1 -
2
-
3
-
4
-
5
-
6
-
7
-
8
-
9
-
10
-
11
-
12
-
13
-
14
-
15
-
16
-
17
-
18
-
19
-
20
-
21
-
22
-
23
-
24
-
25
-
26
-
27
-
28
-
29
-
30
-
31
-
32
-
33
-
34
-
35
-
36
-
37
-
38
-
39
-
40
-
41
-
42
-
43
-
44
-
45
-
46
-
47
-
48
-
49
-
50
-
51
-
52
-
53
-
54
-
55
-
56
-
57
-
58
-
59
-
60
-
61
-
62
-
63
-
64
-
65
-
66
-
67
-
68
-
69
-
70
-
71
-
72
-
73
-
74
-
75
-
76
-
77
-
78
-
79
-
80
-
81
-
82
-
83
-
84
-
85
-
86
-
87
-
88
-
89
-
90
-
91
-
92
-
93
-
94
-
 95
95 -
 96
96 -
 97
97 -
 98
98 -
 99
99 -
 100
100 -
 101
101 -
 102
102 -
 103
103 -
 104
104 -
 105
105 -
 106
106 -
 107
107 -
 108
108 -
 109
109 -
 110
110 -
 111
111 -
 112
112 -
 113
113 -
 114
114 -
 115
115 -
116
-
117
-
118
-
119
-
120
-
121
-
122
-
123
-
124
-
125
-
126
-
127
-
128
-
129
-
130
-
131
-
132
-
133
-
134
-
135
-
136
-
137
-
138
-
139
-
140
-
141
-
142
-
143
-
144
-
145
-
146
-
147
-
148
-
149
-
150
-
151
-
152
-
153
-
154
-
155
-
156
-
157
-
158
-
159
-
160
-
161
-
162
-
163
-
164
-
165
-
166
-
167
-
168
-
169
-
170
-
171
-
172
-
173
-
174
-
175
-
176
-
177
-
178
-
179
-
180
-
181
-
182
-
183
-
184
-
185
-
186
-
187
-
188
-
189
-
190
-
191
-
192
-
193
-
194
-
195
-
196
-
197
-
198
-
199
-
200
-
201
-
202
-
203
-
204
-
205
-
206
-
207
-
208
-
209
-
210
-
211
-
212
-
213
-
214
-
215
-
216
-
217
-
218
-
219
-
220
-
221
-
222
-
223
-
224
-
225
-
226
-
227
-
228
-
229
-
230
-
231
-
232
-
233
-
234
-
235
-
236
-
237
-
238
-
239
-
240
-
241
-
242
-
243
-
244
-
245
-
246
-
247
-
248
-
249
-
250
-
251
-
252
-
253
-
254
-
255
-
256
-
257
-
258
-
259
-
260
-
261
-
262
-
263
-
264
-
265
-
266
-
267
-
268
-
269
-
270
-
271
-
272
-
273
-
274
-
275
-
276
-
277
-
278
-
279
-
280
-
281
-
282
-
283
-
284
-
285
-
286
-
287
-
288
-
289
-
290
-
291
-
292
-
293
-
294
-
295
-
296
-
297
-
298
 |
 |

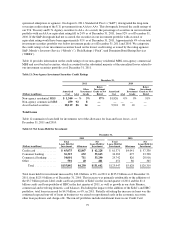
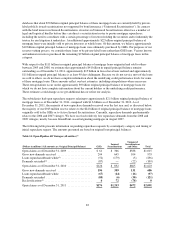
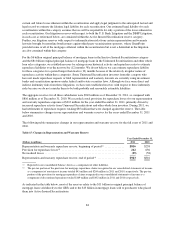
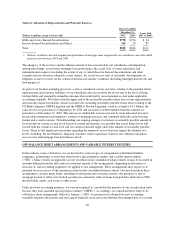
Table 16: Allocation of Representation and Warranty Reserves
Reserve Liability
December 31, Loans Sold
2005 to 2008(1)
(Dollars in millions, except for loans sold) 2011 2010
GSEs and Active Insured Securitizations ................................. $778 $796 $ 24
Inactive Insured Securitizations and Others ............................... 165 20 87
Total ............................................................. $943 $816 $111
(1) Reflects, in billions, the total original principal balance of mortgage loans originated by our subsidiaries and sold to third
party investors between 2005 and 2008.
The adequacy of the reserves and the ultimate amount of losses incurred by our subsidiaries will depend on,
among other things, actual future mortgage loan performance, the actual level of future repurchase and
indemnification requests (including the extent, if any, to which Inactive Insured Securitizations and other
currently inactive investors ultimately assert claims), the actual success rates of claimants, developments in
litigation, actual recoveries on the collateral and macroeconomic conditions (including unemployment levels and
housing prices).
As part of our business planning processes, we have considered various outcomes relating to the potential future
representation and warranty liabilities of our subsidiaries that are possible but do not rise to the level of being
both probable and reasonably estimable outcomes that would justify an incremental accrual under applicable
accounting standards. We believe that the upper end of the reasonably possible future losses from representation
and warranty claims beyond the current accrual levels, including reasonably possible future losses relating to the
US Bank Litigation, DBSP Litigation and the FHLB of Boston Litigation, could be as high as $1.5 billion, the
same level as we provided as of September 30, 2011 and an increase of $400 million from the estimate we
provided as of December 31, 2010. This increase is attributable to increased activity from uninsured investors,
increased governmental and regulatory scrutiny of mortgage practices and continued difficulty in the housing
market and overall economy. Notwithstanding our ongoing attempts to estimate a reasonably possible amount of
loss beyond our current accrual levels based on current information, it is possible that actual future losses will
exceed both the current accrual level and our current estimated upper-end of the amount of reasonably possible
losses. There is still significant uncertainty regarding the numerous factors that may impact the ultimate loss
levels, including, but not limited to, litigation outcomes, future repurchase claims levels, ultimate repurchase
success rates and mortgage loan performance levels.
OFF-BALANCE SHEET ARRANGEMENTS AND VARIABLE INTEREST ENTITIES
In the ordinary course of business, we are involved in various types of arrangements with limited liability
companies, partnerships or trusts that often involve special purpose entities and variable interest entities
(“VIEs”). Some of these arrangements are not recorded on our consolidated balance sheets or may be recorded in
amounts different from the full contract or notional amount of the arrangements, depending on the nature or
structure of, and accounting required to be applied to, the arrangement. These arrangements may expose us to
potential losses in excess of the amounts recorded in the consolidated balance sheets. Our involvement in these
arrangements can take many forms, including securitization and servicing activities, the purchase or sale of
mortgage-backed or other asset-backed securities in connection with our home loan portfolio and loans to VIEs
that hold debt, equity, real estate or other assets.
Under previous accounting guidance, we were not required to consolidate the majority of our securitization trusts
because they were qualified special purpose entities (“QSPEs”). Accordingly, we considered these trusts to be
off-balance sheet arrangements. Effective January 1, 2010, we prospectively adopted two new accounting
standards related to the transfer and servicing of financial assets and consolidations that changed how we account
85