Capital One 2011 Annual Report Download - page 126
Download and view the complete annual report
Please find page 126 of the 2011 Capital One annual report below. You can navigate through the pages in the report by either clicking on the pages listed below, or by using the keyword search tool below to find specific information within the annual report.-
 1
1 -
2
-
3
-
4
-
5
-
6
-
7
-
8
-
9
-
10
-
11
-
12
-
13
-
14
-
15
-
16
-
17
-
18
-
19
-
20
-
21
-
22
-
23
-
24
-
25
-
26
-
27
-
28
-
29
-
30
-
31
-
32
-
33
-
34
-
35
-
36
-
37
-
38
-
39
-
40
-
41
-
42
-
43
-
44
-
45
-
46
-
47
-
48
-
49
-
50
-
51
-
52
-
53
-
54
-
55
-
56
-
57
-
58
-
59
-
60
-
61
-
62
-
63
-
64
-
65
-
66
-
67
-
68
-
69
-
70
-
71
-
72
-
73
-
74
-
75
-
76
-
77
-
78
-
79
-
80
-
81
-
82
-
83
-
84
-
85
-
86
-
87
-
88
-
89
-
90
-
91
-
92
-
93
-
94
-
95
-
96
-
97
-
98
-
99
-
100
-
101
-
102
-
103
-
104
-
105
-
106
-
107
-
108
-
109
-
110
-
111
-
112
-
113
-
114
-
115
-
 116
116 -
 117
117 -
 118
118 -
 119
119 -
 120
120 -
 121
121 -
 122
122 -
 123
123 -
 124
124 -
 125
125 -
 126
126 -
 127
127 -
 128
128 -
 129
129 -
 130
130 -
 131
131 -
 132
132 -
 133
133 -
 134
134 -
 135
135 -
 136
136 -
137
-
138
-
139
-
140
-
141
-
142
-
143
-
144
-
145
-
146
-
147
-
148
-
149
-
150
-
151
-
152
-
153
-
154
-
155
-
156
-
157
-
158
-
159
-
160
-
161
-
162
-
163
-
164
-
165
-
166
-
167
-
168
-
169
-
170
-
171
-
172
-
173
-
174
-
175
-
176
-
177
-
178
-
179
-
180
-
181
-
182
-
183
-
184
-
185
-
186
-
187
-
188
-
189
-
190
-
191
-
192
-
193
-
194
-
195
-
196
-
197
-
198
-
199
-
200
-
201
-
202
-
203
-
204
-
205
-
206
-
207
-
208
-
209
-
210
-
211
-
212
-
213
-
214
-
215
-
216
-
217
-
218
-
219
-
220
-
221
-
222
-
223
-
224
-
225
-
226
-
227
-
228
-
229
-
230
-
231
-
232
-
233
-
234
-
235
-
236
-
237
-
238
-
239
-
240
-
241
-
242
-
243
-
244
-
245
-
246
-
247
-
248
-
249
-
250
-
251
-
252
-
253
-
254
-
255
-
256
-
257
-
258
-
259
-
260
-
261
-
262
-
263
-
264
-
265
-
266
-
267
-
268
-
269
-
270
-
271
-
272
-
273
-
274
-
275
-
276
-
277
-
278
-
279
-
280
-
281
-
282
-
283
-
284
-
285
-
286
-
287
-
288
-
289
-
290
-
291
-
292
-
293
-
294
-
295
-
296
-
297
-
298
 |
 |

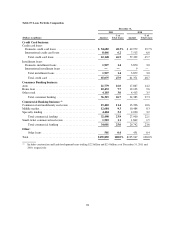
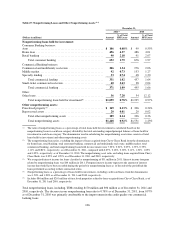
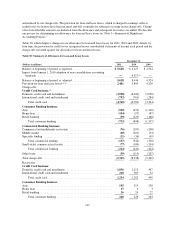
Table 27: Nonperforming Loans and Other Nonperforming Assets(1)(2)
December 31,
2011(3) 2010
(Dollars in millions) Amount
% of Total
HFI Loans Amount
% of Total
HFI Loans
Nonperforming loans held for investment:
Consumer Banking business:
Auto .................................................... $ 106 0.48% $ 99 0.55%
Home loan ............................................... 456 4.37 486 4.01
Retail banking ............................................ 90 2.18 91 2.07
Total consumer banking ................................ 652 1.79 676 1.97
Commercial Banking business:
Commercial and multifamily real estate ........................ 206 1.34 276 2.06
Middle market ............................................ 92 0.73 133 1.27
Specialty lending .......................................... 33 0.74 48 1.20
Total commercial lending ............................... 331 1.02 457 1.64
Small-ticket commercial real estate ............................ 40 2.63 38 2.04
Total commercial banking ............................... 371 1.09 495 1.66
Other:
Other loans ............................................... 36 7.28 54 12.12
Total nonperforming loans held for investment(4) ............. $1,059 0.78% $1,225 0.97%
Other nonperforming assets:
Foreclosed property(5) ...................................... $ 169 0.13% $ 306 0.24%
Repossessed assets ......................................... 20 0.01 20 0.02
Total other nonperforming assets ......................... 189 0.14 326 0.26
Total nonperforming assets .............................. $1,248 0.92% $1,551 1.23%
(1) The ratio of nonperforming loans as a percentage of total loans held for investment is calculated based on the
nonperforming loans in each loan category divided by the total outstanding unpaid principal balance of loans held for
investment in each loan category. The denominator used in calculating the nonperforming asset ratios consists of total
loans held for investment and other nonperforming assets.
(2) The nonperforming loan ratios, excluding the impact of loans acquired from Chevy Chase Bank from the denominator,
for home loan, retail banking, total consumer banking, commercial and multifamily real estate, middle market, total
commercial banking, and total nonperforming loans held for investment were 7.22%, 2.21%, 2.03%, 1.35%, 0.75%,
1.11% and 0.81%, respectively, as of December 31, 2011, compared with 6.67%, 2.16%, 2.30%, 2.11%, 1.30%, 1.69%
and 1.02%, respectively, as of December 31, 2010. The nonperforming asset ratio, excluding loans acquired from Chevy
Chase Bank, was 0.95% and 1.29% as of December 31, 2011 and 2010, respectively.
(3) We recognized interest income for loans classified as nonperforming of $31 million in 2011. Interest income foregone
related to nonperforming loans was $44 million in 2011. Foregone interest income represents the amount of interest
income that would have been recorded during the period for nonperforming loans as of the end of the period had the
loans performed according to their contractual terms.
(4) Nonperforming loans as a percentage of loans held for investment, excluding credit card loans from the denominator,
was 1.50% and 1.90% as of December 31, 2011 and 2010, respectively.
(5) Includes $86 million and $201 million of foreclosed properties related to loans acquired from Chevy Chase Bank, as of
December 31, 2011 and 2010, respectively.
Total nonperforming loans, including, TDRs totaling $170 million and $96 million as of December 31, 2011 and
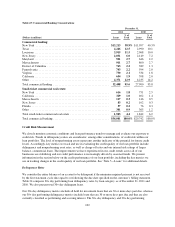
2010, respectively. The decrease in our nonperforming loan ratio to 0.78% as of December 31, 2011, from 0.97%
as of December 31, 2010 was primarily attributable to the improvement in the credit quality our commercial
banking loans.
106