Capital One 2011 Annual Report Download - page 213
Download and view the complete annual report
Please find page 213 of the 2011 Capital One annual report below. You can navigate through the pages in the report by either clicking on the pages listed below, or by using the keyword search tool below to find specific information within the annual report.-
 1
1 -
2
-
3
-
4
-
5
-
6
-
7
-
8
-
9
-
10
-
11
-
12
-
13
-
14
-
15
-
16
-
17
-
18
-
19
-
20
-
21
-
22
-
23
-
24
-
25
-
26
-
27
-
28
-
29
-
30
-
31
-
32
-
33
-
34
-
35
-
36
-
37
-
38
-
39
-
40
-
41
-
42
-
43
-
44
-
45
-
46
-
47
-
48
-
49
-
50
-
51
-
52
-
53
-
54
-
55
-
56
-
57
-
58
-
59
-
60
-
61
-
62
-
63
-
64
-
65
-
66
-
67
-
68
-
69
-
70
-
71
-
72
-
73
-
74
-
75
-
76
-
77
-
78
-
79
-
80
-
81
-
82
-
83
-
84
-
85
-
86
-
87
-
88
-
89
-
90
-
91
-
92
-
93
-
94
-
95
-
96
-
97
-
98
-
99
-
100
-
101
-
102
-
103
-
104
-
105
-
106
-
107
-
108
-
109
-
110
-
111
-
112
-
113
-
114
-
115
-
116
-
117
-
118
-
119
-
120
-
121
-
122
-
123
-
124
-
125
-
126
-
127
-
128
-
129
-
130
-
131
-
132
-
133
-
134
-
135
-
136
-
137
-
138
-
139
-
140
-
141
-
142
-
143
-
144
-
145
-
146
-
147
-
148
-
149
-
150
-
151
-
152
-
153
-
154
-
155
-
156
-
157
-
158
-
159
-
160
-
161
-
162
-
163
-
164
-
165
-
166
-
167
-
168
-
169
-
170
-
171
-
172
-
173
-
174
-
175
-
176
-
177
-
178
-
179
-
180
-
181
-
182
-
183
-
184
-
185
-
186
-
187
-
188
-
189
-
190
-
191
-
192
-
193
-
194
-
195
-
196
-
197
-
198
-
199
-
200
-
201
-
202
-
 203
203 -
 204
204 -
 205
205 -
 206
206 -
 207
207 -
 208
208 -
 209
209 -
 210
210 -
 211
211 -
 212
212 -
 213
213 -
 214
214 -
 215
215 -
 216
216 -
 217
217 -
 218
218 -
 219
219 -
 220
220 -
 221
221 -
 222
222 -
 223
223 -
224
-
225
-
226
-
227
-
228
-
229
-
230
-
231
-
232
-
233
-
234
-
235
-
236
-
237
-
238
-
239
-
240
-
241
-
242
-
243
-
244
-
245
-
246
-
247
-
248
-
249
-
250
-
251
-
252
-
253
-
254
-
255
-
256
-
257
-
258
-
259
-
260
-
261
-
262
-
263
-
264
-
265
-
266
-
267
-
268
-
269
-
270
-
271
-
272
-
273
-
274
-
275
-
276
-
277
-
278
-
279
-
280
-
281
-
282
-
283
-
284
-
285
-
286
-
287
-
288
-
289
-
290
-
291
-
292
-
293
-
294
-
295
-
296
-
297
-
298
 |
 |

CAPITAL ONE FINANCIAL CORPORATION
NOTES TO CONSOLIDATED STATEMENTS—(Continued)
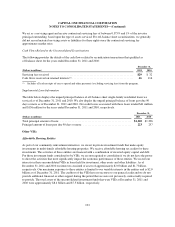
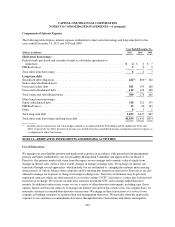
We act as a servicing agent and receive contractual servicing fees of between 0.375% and 1% of the investor
principal outstanding, based upon the type of assets serviced. For off-balance sheet securitizations, we generally
did not record material servicing assets or liabilities for these rights since the contractual servicing fee
approximates market rates.
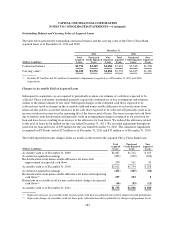
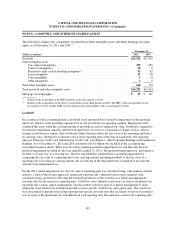
Cash Flows Related to the Unconsolidated Securitizations
The following provides the details of the cash flows related to securitization transactions that qualified as
off-balance sheet for the years ended December 31, 2011 and 2010:
December 31,
(Dollars in millions) 2011 2010
Servicing fees received .......................................................... $29 $ 32
Cash flows received on retained interests(1) ........................................... 46 116
(1) Includes all cash receipts of excess spread and other payments (excluding servicing fees) from the program.
Supplemental Loan Information
The table below displays the unpaid principal balance of off-balance sheet single-family residential loans we
serviced as of December 31, 2011 and 2010. We also display the unpaid principal balance of loans past due 90
days or more as of December 31, 2011 and 2010. Net credit losses associated with these loans totaled $41 million
and $136 million for the years ended December 31, 2011 and 2010, respectively.
December 31,
(Dollars in millions) 2011 2010
Total principal amount of loans .................................................. $1,220 $1,396
Principal amount of loans past due 90 days or more .................................. 223 257
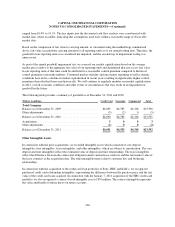
Other VIEs
Affordable Housing Entities
As part of our community reinvestment initiatives, we invest in private investment funds that make equity
investments in multi-family affordable housing properties. We receive affordable housing tax credits for these
investments. The activities of these entities are financed with a combination of invested equity capital and debt.
For those investment funds considered to be VIEs, we are not required to consolidate if we do not have the power
to direct the activities that most significantly impact the economic performance of those entities. We record our
interests in these unconsolidated VIEs in loans held for investment, other assets and other liabilities. As of
December 31, 2011 and 2010 our interests consisted of assets of approximately $2.0 billion and $1.7 billion,
respectively. Our maximum exposure to these entities is limited to our variable interests in the entities and is $2.0
billion as of December 31, 2011. The creditors of the VIEs have no recourse to our general credit and we do not
provide additional financial or other support during the period that we were not previously contractually required
to provide. The total assets of the unconsolidated investment funds that were VIEs at December 31, 2011 and
2010 were approximately $8.4 billion and $7.5 billion, respectively.
193