Capital One 2011 Annual Report Download - page 119
Download and view the complete annual report
Please find page 119 of the 2011 Capital One annual report below. You can navigate through the pages in the report by either clicking on the pages listed below, or by using the keyword search tool below to find specific information within the annual report.-
 1
1 -
2
-
3
-
4
-
5
-
6
-
7
-
8
-
9
-
10
-
11
-
12
-
13
-
14
-
15
-
16
-
17
-
18
-
19
-
20
-
21
-
22
-
23
-
24
-
25
-
26
-
27
-
28
-
29
-
30
-
31
-
32
-
33
-
34
-
35
-
36
-
37
-
38
-
39
-
40
-
41
-
42
-
43
-
44
-
45
-
46
-
47
-
48
-
49
-
50
-
51
-
52
-
53
-
54
-
55
-
56
-
57
-
58
-
59
-
60
-
61
-
62
-
63
-
64
-
65
-
66
-
67
-
68
-
69
-
70
-
71
-
72
-
73
-
74
-
75
-
76
-
77
-
78
-
79
-
80
-
81
-
82
-
83
-
84
-
85
-
86
-
87
-
88
-
89
-
90
-
91
-
92
-
93
-
94
-
95
-
96
-
97
-
98
-
99
-
100
-
101
-
102
-
103
-
104
-
105
-
106
-
107
-
108
-
 109
109 -
 110
110 -
 111
111 -
 112
112 -
 113
113 -
 114
114 -
 115
115 -
 116
116 -
 117
117 -
 118
118 -
 119
119 -
 120
120 -
 121
121 -
 122
122 -
 123
123 -
 124
124 -
 125
125 -
 126
126 -
 127
127 -
 128
128 -
 129
129 -
130
-
131
-
132
-
133
-
134
-
135
-
136
-
137
-
138
-
139
-
140
-
141
-
142
-
143
-
144
-
145
-
146
-
147
-
148
-
149
-
150
-
151
-
152
-
153
-
154
-
155
-
156
-
157
-
158
-
159
-
160
-
161
-
162
-
163
-
164
-
165
-
166
-
167
-
168
-
169
-
170
-
171
-
172
-
173
-
174
-
175
-
176
-
177
-
178
-
179
-
180
-
181
-
182
-
183
-
184
-
185
-
186
-
187
-
188
-
189
-
190
-
191
-
192
-
193
-
194
-
195
-
196
-
197
-
198
-
199
-
200
-
201
-
202
-
203
-
204
-
205
-
206
-
207
-
208
-
209
-
210
-
211
-
212
-
213
-
214
-
215
-
216
-
217
-
218
-
219
-
220
-
221
-
222
-
223
-
224
-
225
-
226
-
227
-
228
-
229
-
230
-
231
-
232
-
233
-
234
-
235
-
236
-
237
-
238
-
239
-
240
-
241
-
242
-
243
-
244
-
245
-
246
-
247
-
248
-
249
-
250
-
251
-
252
-
253
-
254
-
255
-
256
-
257
-
258
-
259
-
260
-
261
-
262
-
263
-
264
-
265
-
266
-
267
-
268
-
269
-
270
-
271
-
272
-
273
-
274
-
275
-
276
-
277
-
278
-
279
-
280
-
281
-
282
-
283
-
284
-
285
-
286
-
287
-
288
-
289
-
290
-
291
-
292
-
293
-
294
-
295
-
296
-
297
-
298
 |
 |

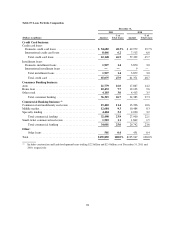
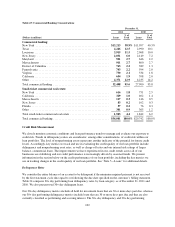
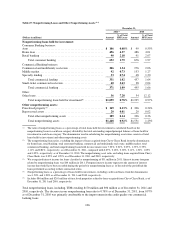
Table 20 presents a schedule of our loan maturities as of December 31, 2011.
Table 20: Loan Maturity Schedule
December 31, 2011
(Dollars in millions)
Due Up to
1 Year
> 1 Year
to 5 Years > 5 Years Total
Fixed rate:
Credit card(1)(2) ........................................... $ 2,557 $13,846 $ 64 $ 16,467
Consumer ............................................... 986 14,814 11,539 27,339
Commercial ............................................. 1,402 6,942 4,981 13,325
Other .................................................. 13 38 147 198
Total fixed-rate loans ...................................... 4,958 35,640 16,731 57,329
Variable rate:
Credit card(1) ............................................ 48,608 — — 48,608
Consumer ............................................... 7,803 1,001 172 8,976
Commercial ............................................. 18,571 2,021 84 20,676
Other .................................................. 264 12 27 303
Total variable-rate loans ................................... 75,246 3,034 283 78,563
Total ................................................... $80,204 $38,674 $17,014 $135,892
(1) Due to the revolving nature of credit card loans, we report all variable-rate credit card loans as due in one year or less.
We report fixed-rate credit card loans with introductory rates that expire after a certain period of time as due in one year
or less. We assume that our remaining fixed-rate credit card loans will mature within one to three years.
(2) Includes installment loans of $1.9 billion.
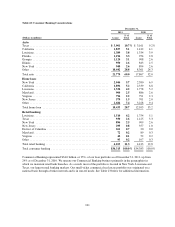
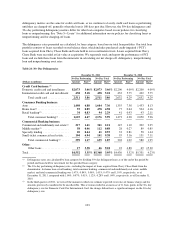
We market our credit card products on a national basis throughout the United States, Canada and the United
Kingdom. The Credit Card segment accounted for $65.1 billion, or 48% of our total loan portfolio as of
December 31, 2011, compared with $61.4 billion, or 49% as of December 31, 2010. Because of the diversity of
our credit card products and national marketing approach, no single geographic concentration exists within the
credit card portfolio. Table 21 displays the geographic concentration of our credit card loan portfolio as of
December 31, 2011 and 2010.
99