Capital One 2011 Annual Report Download - page 129
Download and view the complete annual report
Please find page 129 of the 2011 Capital One annual report below. You can navigate through the pages in the report by either clicking on the pages listed below, or by using the keyword search tool below to find specific information within the annual report.-
 1
1 -
2
-
3
-
4
-
5
-
6
-
7
-
8
-
9
-
10
-
11
-
12
-
13
-
14
-
15
-
16
-
17
-
18
-
19
-
20
-
21
-
22
-
23
-
24
-
25
-
26
-
27
-
28
-
29
-
30
-
31
-
32
-
33
-
34
-
35
-
36
-
37
-
38
-
39
-
40
-
41
-
42
-
43
-
44
-
45
-
46
-
47
-
48
-
49
-
50
-
51
-
52
-
53
-
54
-
55
-
56
-
57
-
58
-
59
-
60
-
61
-
62
-
63
-
64
-
65
-
66
-
67
-
68
-
69
-
70
-
71
-
72
-
73
-
74
-
75
-
76
-
77
-
78
-
79
-
80
-
81
-
82
-
83
-
84
-
85
-
86
-
87
-
88
-
89
-
90
-
91
-
92
-
93
-
94
-
95
-
96
-
97
-
98
-
99
-
100
-
101
-
102
-
103
-
104
-
105
-
106
-
107
-
108
-
109
-
110
-
111
-
112
-
113
-
114
-
115
-
116
-
117
-
118
-
 119
119 -
 120
120 -
 121
121 -
 122
122 -
 123
123 -
 124
124 -
 125
125 -
 126
126 -
 127
127 -
 128
128 -
 129
129 -
 130
130 -
 131
131 -
 132
132 -
 133
133 -
 134
134 -
 135
135 -
 136
136 -
 137
137 -
 138
138 -
 139
139 -
140
-
141
-
142
-
143
-
144
-
145
-
146
-
147
-
148
-
149
-
150
-
151
-
152
-
153
-
154
-
155
-
156
-
157
-
158
-
159
-
160
-
161
-
162
-
163
-
164
-
165
-
166
-
167
-
168
-
169
-
170
-
171
-
172
-
173
-
174
-
175
-
176
-
177
-
178
-
179
-
180
-
181
-
182
-
183
-
184
-
185
-
186
-
187
-
188
-
189
-
190
-
191
-
192
-
193
-
194
-
195
-
196
-
197
-
198
-
199
-
200
-
201
-
202
-
203
-
204
-
205
-
206
-
207
-
208
-
209
-
210
-
211
-
212
-
213
-
214
-
215
-
216
-
217
-
218
-
219
-
220
-
221
-
222
-
223
-
224
-
225
-
226
-
227
-
228
-
229
-
230
-
231
-
232
-
233
-
234
-
235
-
236
-
237
-
238
-
239
-
240
-
241
-
242
-
243
-
244
-
245
-
246
-
247
-
248
-
249
-
250
-
251
-
252
-
253
-
254
-
255
-
256
-
257
-
258
-
259
-
260
-
261
-
262
-
263
-
264
-
265
-
266
-
267
-
268
-
269
-
270
-
271
-
272
-
273
-
274
-
275
-
276
-
277
-
278
-
279
-
280
-
281
-
282
-
283
-
284
-
285
-
286
-
287
-
288
-
289
-
290
-
291
-
292
-
293
-
294
-
295
-
296
-
297
-
298
 |
 |

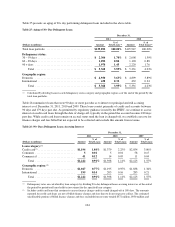
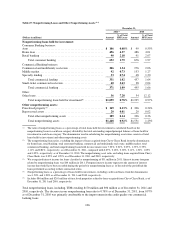
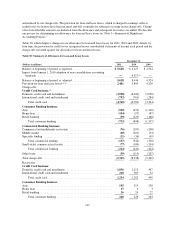
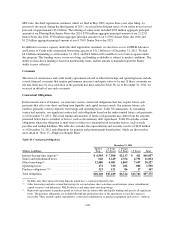
Table 29: Loan Modifications and Restructurings(1)
December 31,
(Dollars in millions) 2011 2010(2)
Modified and restructured loans:
Credit card(3) ................................................................. $ 898 $ 913
Auto(4) ...................................................................... 58 —
Home loan ................................................................... 104 57
Retail banking ................................................................ 80 13
Commercial .................................................................. 426 162
Total ................................................................... $1,566 $1,145
Status of modified and restructured loans:
Performing ................................................................... $1,396 $1,049
Nonperforming ............................................................... 170 96
Total ................................................................... $1,566 $1,145
(1) Reflects modifications and restructuring of loans in our total loan portfolio. The total loan portfolio includes loans
recorded on our balance sheet and loans held in securitization trusts.
(2) Certain prior period amounts have been reclassified to conform to the current period presentation.
(3) Amount reported reflects the total outstanding customer balance, which consists of unpaid principal balance, accrued
interest and fees.
(4) Prior to the first quarter of 2011, modified Auto loans were charged-off at the net collateral value and the remaining asset
balance was reclassified to Other Assets on our consolidated balance sheet.
The outstanding balance of loan modifications made to assist borrowers experiencing financial difficulties
increased to $1.6 billion as of December 31, 2011, from $1.1 billion as of December 31, 2010. Of these
modifications, approximately $170 million, or 11%, were classified as nonperforming as of December 31, 2011,
compared with $96 million, or 8%, as of December 31, 2010.
Credit card loan modifications have accounted for the majority of our TDR loan modifications, representing $898
million, or 57%, of the outstanding balance of total TDR loans as of December 31, 2011, and $913 million, or
80%, of the outstanding balance of total TDR loans as of December 31, 2010. The vast majority of our credit
card TDR loan modifications involve a reduction in the interest rate on the account and placing the customer on a
fixed payment plan not exceeding 60 months. In some cases, the interest rate on a credit card account is
automatically increased due to non-payment, late payment or similar events. We determine the effective interest
rate for purposes of measuring impairment on modified loans that involve an increase and are considered to be a
TDR based on the interest rate in effect immediately prior to the loan entering the modification program. In all
cases, we cancel the customer’s available line of credit on the credit card. If the cardholder does not comply with
the modified payment terms, then the credit card loan agreement will revert back to its original payment terms,
with the amount of any loan outstanding reflected in the appropriate delinquency category. The loan amount may
then be charged-off in accordance with our standard charge-off policy.
Home loan modifications represented $104 million, or 7%, of the outstanding balance of total modified loans as
of December 31, 2011, compared with $57 million, or 5%, of the outstanding balance of total modified loans as
of December 31, 2010. The majority of our modified home loans involve a combination of an interest rate
reduction, term extension or principal reduction.
Retail banking loan modifications represented $80 million, or 5% of the outstanding balance of total modified
loans as of December 31, 2011 compared with $13 million or 1% of the outstanding balance of total loans as of
December 31, 2010. Small business loan modifications represent $60 million or 75% of the outstanding Retail
banking loan modifications as of December 31, 2011. Approximately, 50% of the Small Business TDRs in 2011
were added as a result of the adoption of the accounting guidance clarifying TDRs.
109