Capital One 2011 Annual Report Download - page 215
Download and view the complete annual report
Please find page 215 of the 2011 Capital One annual report below. You can navigate through the pages in the report by either clicking on the pages listed below, or by using the keyword search tool below to find specific information within the annual report.-
 1
1 -
2
-
3
-
4
-
5
-
6
-
7
-
8
-
9
-
10
-
11
-
12
-
13
-
14
-
15
-
16
-
17
-
18
-
19
-
20
-
21
-
22
-
23
-
24
-
25
-
26
-
27
-
28
-
29
-
30
-
31
-
32
-
33
-
34
-
35
-
36
-
37
-
38
-
39
-
40
-
41
-
42
-
43
-
44
-
45
-
46
-
47
-
48
-
49
-
50
-
51
-
52
-
53
-
54
-
55
-
56
-
57
-
58
-
59
-
60
-
61
-
62
-
63
-
64
-
65
-
66
-
67
-
68
-
69
-
70
-
71
-
72
-
73
-
74
-
75
-
76
-
77
-
78
-
79
-
80
-
81
-
82
-
83
-
84
-
85
-
86
-
87
-
88
-
89
-
90
-
91
-
92
-
93
-
94
-
95
-
96
-
97
-
98
-
99
-
100
-
101
-
102
-
103
-
104
-
105
-
106
-
107
-
108
-
109
-
110
-
111
-
112
-
113
-
114
-
115
-
116
-
117
-
118
-
119
-
120
-
121
-
122
-
123
-
124
-
125
-
126
-
127
-
128
-
129
-
130
-
131
-
132
-
133
-
134
-
135
-
136
-
137
-
138
-
139
-
140
-
141
-
142
-
143
-
144
-
145
-
146
-
147
-
148
-
149
-
150
-
151
-
152
-
153
-
154
-
155
-
156
-
157
-
158
-
159
-
160
-
161
-
162
-
163
-
164
-
165
-
166
-
167
-
168
-
169
-
170
-
171
-
172
-
173
-
174
-
175
-
176
-
177
-
178
-
179
-
180
-
181
-
182
-
183
-
184
-
185
-
186
-
187
-
188
-
189
-
190
-
191
-
192
-
193
-
194
-
195
-
196
-
197
-
198
-
199
-
200
-
201
-
202
-
203
-
204
-
 205
205 -
 206
206 -
 207
207 -
 208
208 -
 209
209 -
 210
210 -
 211
211 -
 212
212 -
 213
213 -
 214
214 -
 215
215 -
 216
216 -
 217
217 -
 218
218 -
 219
219 -
 220
220 -
 221
221 -
 222
222 -
 223
223 -
 224
224 -
 225
225 -
226
-
227
-
228
-
229
-
230
-
231
-
232
-
233
-
234
-
235
-
236
-
237
-
238
-
239
-
240
-
241
-
242
-
243
-
244
-
245
-
246
-
247
-
248
-
249
-
250
-
251
-
252
-
253
-
254
-
255
-
256
-
257
-
258
-
259
-
260
-
261
-
262
-
263
-
264
-
265
-
266
-
267
-
268
-
269
-
270
-
271
-
272
-
273
-
274
-
275
-
276
-
277
-
278
-
279
-
280
-
281
-
282
-
283
-
284
-
285
-
286
-
287
-
288
-
289
-
290
-
291
-
292
-
293
-
294
-
295
-
296
-
297
-
298
 |
 |

CAPITAL ONE FINANCIAL CORPORATION
NOTES TO CONSOLIDATED STATEMENTS—(Continued)
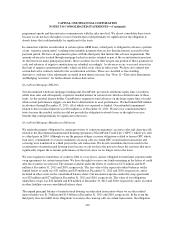
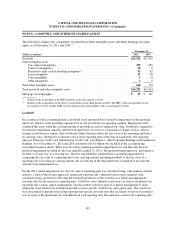
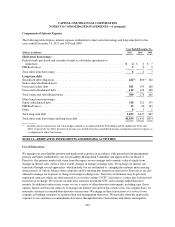
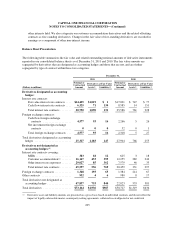
NOTE 8—GOODWILL AND OTHER INTANGIBLE ASSETS
The table below displays the components of goodwill and other intangible assets, including mortgage servicing
rights, as of December 31, 2011 and 2010:
December 31,
(Dollars in millions) 2011 2010
Goodwill .................................................................. $13,592 $13,591
Other intangible assets:
Core deposit intangibles .................................................. 479 650
Contract intangibles(1) .................................................... 50 0
Purchased credit card relationship intangibles(2) ............................... 52 42
Lease intangibles ........................................................ 21 26
Trust intangibles ........................................................ 56
Other intangibles ........................................................ 39
Total other intangible assets ................................................... 610 733
Total goodwill and other intangible assets ........................................ $14,202 $14,324
Mortgage servicing rights ..................................................... $ 93 $ 141
(1) Relates to the acquisition of the HBC portfolio in the first quarter of 2011.
(2) Relates to the acquisitions of the Sony Card portfolio in the third quarter of 2010, the HBC credit card portfolio in the
first quarter of 2011 and the Kohl’s private-label credit card portfolio in the second quarter of 2011.
Goodwill
In accordance with accounting guidance, goodwill is not amortized but is tested for impairment at the reporting
unit level, which is at the operating segment level or one level below an operating segment. Impairment is the
condition that exists when the carrying amount of goodwill exceeds its implied fair value. Goodwill is required to
be tested for impairment annually and between annual tests if events or circumstances change, such as adverse
changes in the business climate, that would more likely than not reduce the fair value of the reporting unit below
its carrying value. Goodwill is assigned to one or more reporting units at the date of acquisition. Our reporting
units are Domestic Credit Card, International Credit Card, Auto Finance, other Consumer Banking and Commercial
Banking. As of December 31, 2011 and 2010, goodwill of $13.6 billion was included in the accompanying
consolidated balance sheets. There were no events requiring an interim impairment test and there has been no
goodwill impairment recorded for the year ended December 31, 2011. The goodwill impairment test, performed at
October 1 of each year, is a two-step test. The first step identifies whether there is potential impairment by
comparing the fair value of a reporting unit to the carrying amount, including goodwill. If the fair value of a
reporting unit is less than its carrying amount, the second step of the impairment test is required to measure the
amount of any impairment loss.
For the 2011 annual impairment test, the fair value of reporting units was calculated using a discounted cash flow
analysis, a form of the income approach, using each reporting unit’s internal forecast and a terminal value
calculated using a growth rate reflecting the nominal growth rate of the economy as a whole and appropriate
discount rates for the respective reporting units. Cash flows were adjusted as necessary in order to maintain each
reporting unit’s equity capital requirements. Our discounted cash flow analysis required management to make
judgments about future loan and deposit growth, revenue growth, credit losses, and capital rates. The cash flows
were discounted to present value using reporting unit specific discount rates that are largely based on our external
cost of equity with adjustments for risk inherent in each reporting unit. Discount rates used for the reporting units
195