Capital One 2011 Annual Report Download - page 223
Download and view the complete annual report
Please find page 223 of the 2011 Capital One annual report below. You can navigate through the pages in the report by either clicking on the pages listed below, or by using the keyword search tool below to find specific information within the annual report.-
 1
1 -
2
-
3
-
4
-
5
-
6
-
7
-
8
-
9
-
10
-
11
-
12
-
13
-
14
-
15
-
16
-
17
-
18
-
19
-
20
-
21
-
22
-
23
-
24
-
25
-
26
-
27
-
28
-
29
-
30
-
31
-
32
-
33
-
34
-
35
-
36
-
37
-
38
-
39
-
40
-
41
-
42
-
43
-
44
-
45
-
46
-
47
-
48
-
49
-
50
-
51
-
52
-
53
-
54
-
55
-
56
-
57
-
58
-
59
-
60
-
61
-
62
-
63
-
64
-
65
-
66
-
67
-
68
-
69
-
70
-
71
-
72
-
73
-
74
-
75
-
76
-
77
-
78
-
79
-
80
-
81
-
82
-
83
-
84
-
85
-
86
-
87
-
88
-
89
-
90
-
91
-
92
-
93
-
94
-
95
-
96
-
97
-
98
-
99
-
100
-
101
-
102
-
103
-
104
-
105
-
106
-
107
-
108
-
109
-
110
-
111
-
112
-
113
-
114
-
115
-
116
-
117
-
118
-
119
-
120
-
121
-
122
-
123
-
124
-
125
-
126
-
127
-
128
-
129
-
130
-
131
-
132
-
133
-
134
-
135
-
136
-
137
-
138
-
139
-
140
-
141
-
142
-
143
-
144
-
145
-
146
-
147
-
148
-
149
-
150
-
151
-
152
-
153
-
154
-
155
-
156
-
157
-
158
-
159
-
160
-
161
-
162
-
163
-
164
-
165
-
166
-
167
-
168
-
169
-
170
-
171
-
172
-
173
-
174
-
175
-
176
-
177
-
178
-
179
-
180
-
181
-
182
-
183
-
184
-
185
-
186
-
187
-
188
-
189
-
190
-
191
-
192
-
193
-
194
-
195
-
196
-
197
-
198
-
199
-
200
-
201
-
202
-
203
-
204
-
205
-
206
-
207
-
208
-
209
-
210
-
211
-
212
-
 213
213 -
 214
214 -
 215
215 -
 216
216 -
 217
217 -
 218
218 -
 219
219 -
 220
220 -
 221
221 -
 222
222 -
 223
223 -
 224
224 -
 225
225 -
 226
226 -
 227
227 -
 228
228 -
 229
229 -
 230
230 -
 231
231 -
 232
232 -
 233
233 -
234
-
235
-
236
-
237
-
238
-
239
-
240
-
241
-
242
-
243
-
244
-
245
-
246
-
247
-
248
-
249
-
250
-
251
-
252
-
253
-
254
-
255
-
256
-
257
-
258
-
259
-
260
-
261
-
262
-
263
-
264
-
265
-
266
-
267
-
268
-
269
-
270
-
271
-
272
-
273
-
274
-
275
-
276
-
277
-
278
-
279
-
280
-
281
-
282
-
283
-
284
-
285
-
286
-
287
-
288
-
289
-
290
-
291
-
292
-
293
-
294
-
295
-
296
-
297
-
298
 |
 |

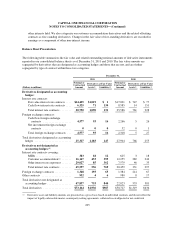
CAPITAL ONE FINANCIAL CORPORATION
NOTES TO CONSOLIDATED STATEMENTS—(Continued)
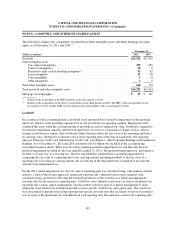
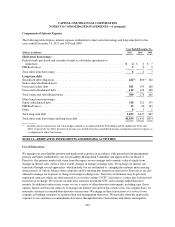
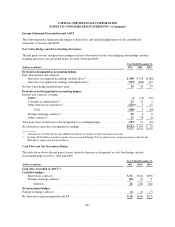
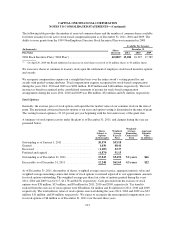
Components of Interest Expense
The following table displays interest expense attributable to short-term borrowings and long-term debt for the
years ended December 31, 2011 and 2010 and 2009:
Year Ended December 31,
(Dollars in millions) 2011 2010 2009
Short-term borrowings:
Federal funds purchased and securities loaned or sold under agreements to
repurchase ........................................................... $4$ 4$7
FHLB advances ......................................................... 200
Total short-term borrowings ............................................... 647
Long-term debt:
Securitized debt obligations ............................................... 422(1) 804(1) 282
Senior and subordinated notes:
Unsecured senior debt .................................................... 181 154 160
Unsecured subordinated debt .............................................. 119 122 100
Total senior and subordinated notes ......................................... 300 276 260
Other long-term borrowings:
Junior subordinated debt .................................................. 310 322 179
FHLB advances ......................................................... 12 20 145
Other ................................................................. 951
Total long-term debt ..................................................... 1,053 1,427 867
Total short-term borrowings and long-term debt ............................... $1,059 $1,431 $874
(1) Includes interest income for fair value hedges related to securitized debt of $25 million and $5 million for 2011 and
2010, respectively. In 2010, the interest income was included on the consolidated income statement in interest expense as
a component of other borrowings.
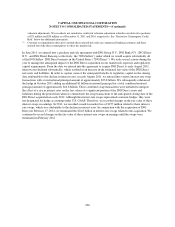
NOTE 11—DERIVATIVE INSTRUMENTS AND HEDGING ACTIVITIES
Use of Derivatives
We manage our asset/liability position and market risk exposure in accordance with prescribed risk management
policies and limits established by our Asset Liability Management Committee and approved by our Board of
Directors. Our primary market risk stems from the impact on our earnings and economic value of equity from
changes in interest rates, and to a lesser extent, changes in foreign exchange rates. We manage our interest rate
sensitivity through several approaches, which include, but are not limited to, changing the maturity and re-pricing
characteristics of various balance sheet categories and by entering into interest rate derivatives. Derivatives are also
utilized to manage our exposure to changes in foreign exchange rates. Derivative instruments may be privately
negotiated contracts, which are often referred to as over-the-counter (“OTC”) derivatives, or they may be listed and
traded on an exchange. We execute our derivative contracts in both the OTC and exchange-traded derivative
markets. In addition to interest rate swaps, we use a variety of other derivative instruments, including caps, floors,
options, futures and forward contracts, to manage our interest rate and foreign currency risk. On a regular basis, we
enter into customer-accommodation derivative transactions. We engage in these transactions as a service to our
commercial banking customers to facilitate their risk management objectives. We typically offset the market risk
exposure to our customer-accommodation derivatives through derivative transactions with other counterparties.
203