Capital One 2011 Annual Report Download - page 247
Download and view the complete annual report
Please find page 247 of the 2011 Capital One annual report below. You can navigate through the pages in the report by either clicking on the pages listed below, or by using the keyword search tool below to find specific information within the annual report.-
 1
1 -
2
-
3
-
4
-
5
-
6
-
7
-
8
-
9
-
10
-
11
-
12
-
13
-
14
-
15
-
16
-
17
-
18
-
19
-
20
-
21
-
22
-
23
-
24
-
25
-
26
-
27
-
28
-
29
-
30
-
31
-
32
-
33
-
34
-
35
-
36
-
37
-
38
-
39
-
40
-
41
-
42
-
43
-
44
-
45
-
46
-
47
-
48
-
49
-
50
-
51
-
52
-
53
-
54
-
55
-
56
-
57
-
58
-
59
-
60
-
61
-
62
-
63
-
64
-
65
-
66
-
67
-
68
-
69
-
70
-
71
-
72
-
73
-
74
-
75
-
76
-
77
-
78
-
79
-
80
-
81
-
82
-
83
-
84
-
85
-
86
-
87
-
88
-
89
-
90
-
91
-
92
-
93
-
94
-
95
-
96
-
97
-
98
-
99
-
100
-
101
-
102
-
103
-
104
-
105
-
106
-
107
-
108
-
109
-
110
-
111
-
112
-
113
-
114
-
115
-
116
-
117
-
118
-
119
-
120
-
121
-
122
-
123
-
124
-
125
-
126
-
127
-
128
-
129
-
130
-
131
-
132
-
133
-
134
-
135
-
136
-
137
-
138
-
139
-
140
-
141
-
142
-
143
-
144
-
145
-
146
-
147
-
148
-
149
-
150
-
151
-
152
-
153
-
154
-
155
-
156
-
157
-
158
-
159
-
160
-
161
-
162
-
163
-
164
-
165
-
166
-
167
-
168
-
169
-
170
-
171
-
172
-
173
-
174
-
175
-
176
-
177
-
178
-
179
-
180
-
181
-
182
-
183
-
184
-
185
-
186
-
187
-
188
-
189
-
190
-
191
-
192
-
193
-
194
-
195
-
196
-
197
-
198
-
199
-
200
-
201
-
202
-
203
-
204
-
205
-
206
-
207
-
208
-
209
-
210
-
211
-
212
-
213
-
214
-
215
-
216
-
217
-
218
-
219
-
220
-
221
-
222
-
223
-
224
-
225
-
226
-
227
-
228
-
229
-
230
-
231
-
232
-
233
-
234
-
235
-
236
-
 237
237 -
 238
238 -
 239
239 -
 240
240 -
 241
241 -
 242
242 -
 243
243 -
 244
244 -
 245
245 -
 246
246 -
 247
247 -
 248
248 -
 249
249 -
 250
250 -
 251
251 -
 252
252 -
 253
253 -
 254
254 -
 255
255 -
 256
256 -
 257
257 -
258
-
259
-
260
-
261
-
262
-
263
-
264
-
265
-
266
-
267
-
268
-
269
-
270
-
271
-
272
-
273
-
274
-
275
-
276
-
277
-
278
-
279
-
280
-
281
-
282
-
283
-
284
-
285
-
286
-
287
-
288
-
289
-
290
-
291
-
292
-
293
-
294
-
295
-
296
-
297
-
298
 |
 |

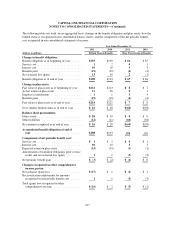
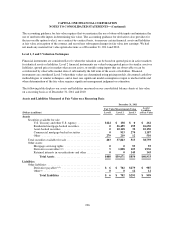
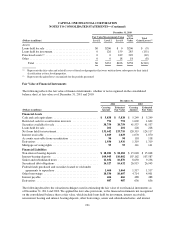
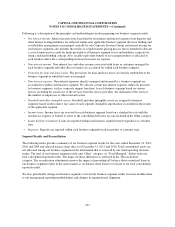
CAPITAL ONE FINANCIAL CORPORATION
NOTES TO CONSOLIDATED STATEMENTS—(Continued)
December 31, 2010
Fair Value Measurements Using Assets/
Liabilities
at Fair Value(Dollars in millions) Level 1 Level 2 Level 3
Assets
Securities available for sale:
U.S. Treasury and other U.S. Agency ................ $386 $ 314 $ 0 $ 700
Residential mortgage-backed securities ............... 0 29,626 578 30,204
Asset-backed securities ........................... 0 9,953 13 9,966
Commercial mortgage-backed securities .............. 0 45 0 45
Other ......................................... 293 322 7 622
Total securities available for sale ........................ 679 40,260 598 41,537
Other assets:
Mortgage servicing rights ......................... 0 0 141 141
Derivative receivables(1)(2) ......................... 8 1,265 46 1,319
Retained interests in securitizations and other .......... 0 0 152 152
Total Assets ................................ $687 $41,525 $937 $43,149
Liabilities
Other liabilities: .....................................
Derivative payables(1) (2) ........................... $ 18 $ 575 $ 43 $ 636
Other(3) ........................................ 0 0 18 18
Total Liabilities ............................ $ 18 $ 575 $ 61 $ 654
(1) We do not offset the fair value of derivative contracts in a loss position against the fair value of contracts in a gain
position. We also do not offset fair value amounts recognized for derivative instruments and fair value amounts
recognized for the right to reclaim cash collateral or the obligation to return cash collateral arising from derivative
instruments executed with the same counterparty under a master netting arrangement.
(2) Does not reflect $23 million and $20 million recognized as a net valuation allowance on derivative assets and liabilities
for non-performance risk as of December 31, 2011 and 2010, respectively. Non-performance risk is reflected in other
assets/liabilities on the balance sheet and offset through the income statement in other income.
(3) Includes manufactured housing, swap and other transactions. See “Note 7—Variable Interest Entities and
Securitizations” for additional information.
The determination of the classification of financial instruments in Level 2 or Level 3 of the fair value hierarchy is
performed at the end of each reporting period. We consider all available information, including observable
market data, indications of market liquidity and orderliness, and our understanding of the valuation techniques
and significant inputs. Based upon the specific facts and circumstances of each instrument or instrument
category, judgments are made regarding the significance of the Level 3 inputs to the instruments’ fair value
measurement in its entirety. If Level 3 inputs are considered significant, the instrument is classified as Level 3.
The process for determining fair value using unobservable inputs is generally more subjective and involves a
high degree of management judgment and assumptions. During 2011, we had minimal movements between
Levels 1 and 2.
227