Capital One 2011 Annual Report Download - page 296
Download and view the complete annual report
Please find page 296 of the 2011 Capital One annual report below. You can navigate through the pages in the report by either clicking on the pages listed below, or by using the keyword search tool below to find specific information within the annual report.-
 1
1 -
2
-
3
-
4
-
5
-
6
-
7
-
8
-
9
-
10
-
11
-
12
-
13
-
14
-
15
-
16
-
17
-
18
-
19
-
20
-
21
-
22
-
23
-
24
-
25
-
26
-
27
-
28
-
29
-
30
-
31
-
32
-
33
-
34
-
35
-
36
-
37
-
38
-
39
-
40
-
41
-
42
-
43
-
44
-
45
-
46
-
47
-
48
-
49
-
50
-
51
-
52
-
53
-
54
-
55
-
56
-
57
-
58
-
59
-
60
-
61
-
62
-
63
-
64
-
65
-
66
-
67
-
68
-
69
-
70
-
71
-
72
-
73
-
74
-
75
-
76
-
77
-
78
-
79
-
80
-
81
-
82
-
83
-
84
-
85
-
86
-
87
-
88
-
89
-
90
-
91
-
92
-
93
-
94
-
95
-
96
-
97
-
98
-
99
-
100
-
101
-
102
-
103
-
104
-
105
-
106
-
107
-
108
-
109
-
110
-
111
-
112
-
113
-
114
-
115
-
116
-
117
-
118
-
119
-
120
-
121
-
122
-
123
-
124
-
125
-
126
-
127
-
128
-
129
-
130
-
131
-
132
-
133
-
134
-
135
-
136
-
137
-
138
-
139
-
140
-
141
-
142
-
143
-
144
-
145
-
146
-
147
-
148
-
149
-
150
-
151
-
152
-
153
-
154
-
155
-
156
-
157
-
158
-
159
-
160
-
161
-
162
-
163
-
164
-
165
-
166
-
167
-
168
-
169
-
170
-
171
-
172
-
173
-
174
-
175
-
176
-
177
-
178
-
179
-
180
-
181
-
182
-
183
-
184
-
185
-
186
-
187
-
188
-
189
-
190
-
191
-
192
-
193
-
194
-
195
-
196
-
197
-
198
-
199
-
200
-
201
-
202
-
203
-
204
-
205
-
206
-
207
-
208
-
209
-
210
-
211
-
212
-
213
-
214
-
215
-
216
-
217
-
218
-
219
-
220
-
221
-
222
-
223
-
224
-
225
-
226
-
227
-
228
-
229
-
230
-
231
-
232
-
233
-
234
-
235
-
236
-
237
-
238
-
239
-
240
-
241
-
242
-
243
-
244
-
245
-
246
-
247
-
248
-
249
-
250
-
251
-
252
-
253
-
254
-
255
-
256
-
257
-
258
-
259
-
260
-
261
-
262
-
263
-
264
-
265
-
266
-
267
-
268
-
269
-
270
-
271
-
272
-
273
-
274
-
275
-
276
-
277
-
278
-
279
-
280
-
281
-
282
-
283
-
284
-
285
-
 286
286 -
 287
287 -
 288
288 -
 289
289 -
 290
290 -
 291
291 -
 292
292 -
 293
293 -
 294
294 -
 295
295 -
 296
296 -
 297
297 -
 298
298
 |
 |
5
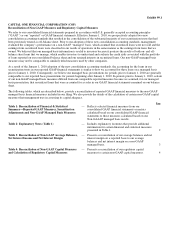
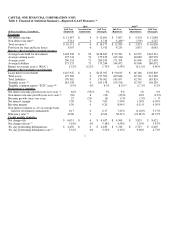
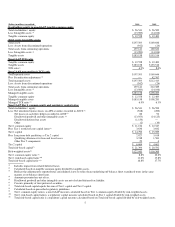
(Dollars in millions)(unaudited) 2010 2009
Stockholders equity to non-GAAP tangible common equity
Total stockholders’ equity
$ 26,541
$ 26,589
Less: Intan
g
ible assets
(13,983)
(14,106)
Tangible common equity
$ 12,558
$ 12,483
Total assets to tangible assets
Total assets
$197,503
$169,646
Less: Assets from discontinued operations
(362)
(24)
Total assets from continuing operations
197,141
169,622
Less: Intangible assets
(13,983)
(14,106)
Tan
g
ible assets
$183,158
$155,516
Non-GAAP TCE ratio
Tan
g
ible common e
q
uit
y
$ 12,558
$ 12,483
Tangible assets
$183,158
$155,516
TCE ratio
6.9%
8.0%
Non-GAAP managed basis TCE ratio
Total reported assets
$197,503
$169,646
Plus: Securitization adjustment
—
42,767
Total managed assets
$197,503
$212,413
Less: Assets from discontinued operations
(362)
(24)
Total assets from continuing operations
197,141
212,389
Less: Intangible assets
(13,983)
(14,106)
Mana
g
ed tan
g
ible assets
$183,158
$198,283
Tangible common equity
$ 12,558
$ 12,483
Managed tangible assets
$183,158
$198,283
Managed TCE ratio
6.9%
6.3%
Non-GAAP Tier 1 common equity and regulatory capital ratios
Total stockholders’ equity
$ 26,541
$ 26,590
Less: Net unrealized (
g
ains) losses on AFS securities recorded in AOCI
(368)
(200)
Net losses on cash flow hedges recorded in AOCI
86
92
Disallowed goodwill and other intangible assets
(13,953)
(14,125)
Disallowed deferred tax assets
(1,150)
—
Other
(2)
(10)
Tier 1 common e
q
uit
y
$ 11,154
$ 12,347
Plus: Tier 1 restricted core capital items
3,636
3,642
Tier 1 capital
$ 14,790
$ 15,989
Plus: Long-term debt qualifying as Tier 2 capital
2,827
3,018
Qualifying allowance for loan and lease losses
3,748
1,581
Other Tier 2 components
29
4
Tier 2 capital
$ 6,604
$ 4,603
Total risk-based capital
$ 21,394
$ 20,592
Risk-weighted assets
$127,043
$116,309
Tier 1 common e
q
uit
y
ratio
8.8%
10.6%
Tier 1 risk-based capital ratio
11.6%
13.8%
Total ris
k
-based ca
p
ital ratio
16.8%
17.7%
Includes impact from related deferred taxes.
Calculated based on tangible common equity divided by tangible assets.
Reflects the adjustment to reported total consolidated assets to reflect loans underlying off-balance sheet securitized trusts in the same
manner as on-balance sheet loans.
Amounts presented are net of tax.
Disallowed goodwill and other intangible assets are net of related deferred tax liability.
Consists primarily of trust preferred securities.
Total risk-based capital equals the sum of Tier 1 capital and Tier 2 capital.
Calculated based on
p
rescribed re
g
ulator
y
g
uidelines.
Tier 1 common equity ratio is a non-GAAP measure calculated based on Tier 1 common equity divided by risk-weighted assets.
Tier 1 risk-based capital ratio is a regulatory capital measure calculated based on Tier 1 capital divided by risk-weighed assets.
Total risk-based capital ratio is a regulatory capital measure calculated based on Total risk-based capital divided by risk-weighed assets.
(1)
(1)
(2)
(3)
(1)
(2)
(4)
(4)
(5)
(6)
(7)
(8)
(9)
(10)
(11)
(1)
(2)
(3)
(4)
(5)
(6)
(7)
(8)
(9)
(10)
(11)