Capital One 2011 Annual Report Download - page 89
Download and view the complete annual report
Please find page 89 of the 2011 Capital One annual report below. You can navigate through the pages in the report by either clicking on the pages listed below, or by using the keyword search tool below to find specific information within the annual report.-
 1
1 -
2
-
3
-
4
-
5
-
6
-
7
-
8
-
9
-
10
-
11
-
12
-
13
-
14
-
15
-
16
-
17
-
18
-
19
-
20
-
21
-
22
-
23
-
24
-
25
-
26
-
27
-
28
-
29
-
30
-
31
-
32
-
33
-
34
-
35
-
36
-
37
-
38
-
39
-
40
-
41
-
42
-
43
-
44
-
45
-
46
-
47
-
48
-
49
-
50
-
51
-
52
-
53
-
54
-
55
-
56
-
57
-
58
-
59
-
60
-
61
-
62
-
63
-
64
-
65
-
66
-
67
-
68
-
69
-
70
-
71
-
72
-
73
-
74
-
75
-
76
-
77
-
78
-
 79
79 -
 80
80 -
 81
81 -
 82
82 -
 83
83 -
 84
84 -
 85
85 -
 86
86 -
 87
87 -
 88
88 -
 89
89 -
 90
90 -
 91
91 -
 92
92 -
 93
93 -
 94
94 -
 95
95 -
 96
96 -
 97
97 -
 98
98 -
 99
99 -
100
-
101
-
102
-
103
-
104
-
105
-
106
-
107
-
108
-
109
-
110
-
111
-
112
-
113
-
114
-
115
-
116
-
117
-
118
-
119
-
120
-
121
-
122
-
123
-
124
-
125
-
126
-
127
-
128
-
129
-
130
-
131
-
132
-
133
-
134
-
135
-
136
-
137
-
138
-
139
-
140
-
141
-
142
-
143
-
144
-
145
-
146
-
147
-
148
-
149
-
150
-
151
-
152
-
153
-
154
-
155
-
156
-
157
-
158
-
159
-
160
-
161
-
162
-
163
-
164
-
165
-
166
-
167
-
168
-
169
-
170
-
171
-
172
-
173
-
174
-
175
-
176
-
177
-
178
-
179
-
180
-
181
-
182
-
183
-
184
-
185
-
186
-
187
-
188
-
189
-
190
-
191
-
192
-
193
-
194
-
195
-
196
-
197
-
198
-
199
-
200
-
201
-
202
-
203
-
204
-
205
-
206
-
207
-
208
-
209
-
210
-
211
-
212
-
213
-
214
-
215
-
216
-
217
-
218
-
219
-
220
-
221
-
222
-
223
-
224
-
225
-
226
-
227
-
228
-
229
-
230
-
231
-
232
-
233
-
234
-
235
-
236
-
237
-
238
-
239
-
240
-
241
-
242
-
243
-
244
-
245
-
246
-
247
-
248
-
249
-
250
-
251
-
252
-
253
-
254
-
255
-
256
-
257
-
258
-
259
-
260
-
261
-
262
-
263
-
264
-
265
-
266
-
267
-
268
-
269
-
270
-
271
-
272
-
273
-
274
-
275
-
276
-
277
-
278
-
279
-
280
-
281
-
282
-
283
-
284
-
285
-
286
-
287
-
288
-
289
-
290
-
291
-
292
-
293
-
294
-
295
-
296
-
297
-
298
 |
 |

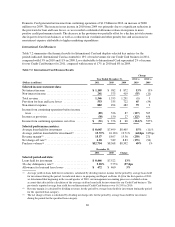
Domestic Card generated net income from continuing operations of $1.9 billion in 2010, an increase of $980
million over 2009. The increase in net income in 2010 from 2009 was primarily due to a significant reduction in
the provision for loan and lease losses, as we recorded a substantial allowance release in response to more
positive credit performance trends. The decrease in the provision was partially offset by a decline in total revenue
due in part to lower loan balances as well as a reduction in overlimit and other penalty fees and an increase in
non-interest expense attributable to higher marketing expenditures.
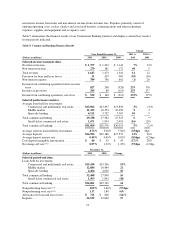
International Card Business
Table 7.2 summarizes the financial results for International Card and displays selected key metrics for the
periods indicated. International Card accounted for 13% of total revenues for our Credit Card business in 2011,
compared with 13% in 2010 and 11% in 2009. Loss attributable to International Card represented 2% of income
for our Credit Card business for 2011, compared with income of 17% in 2010 and 6% in 2009.
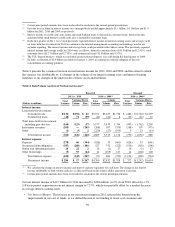
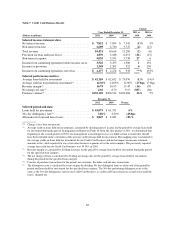
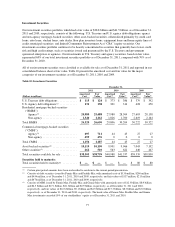
Table 7.2: International Card Business Results
Change
Year Ended December 31, 2011 vs. 2010 vs.
(Dollars in millions) 2011 2010 2009 2010 2009
Selected income statement data:
Net interest income ............................. $ 1,105 $ 982 $ 872 13% 13%
Non-interest income ............................. 241 373 419 (35) (11)
Total revenue .................................. 1,346 1,355 1,291 (1) 5
Provision for loan and lease losses ................. 553 335 722 65 (54)
Non-interest expense ............................ 882 494 482 79 2
Income from continuing operations before income
taxes ....................................... (89) 526 87 (117) 505
Income tax provision ............................ (38) 150 27 (125) 456
Income from continuing operations, net of tax ........ $ (51) $ 376 $ 60 (114)% 527%
Selected performance metrics:
Average loans held for investment ................. $ 8,645 $7,499 $8,405 15% (11)%
Average yield on loans held for investment(1) ......... 15.72% 16.16% 13.71% (44)bps 245bps
Revenue margin(2) .............................. 15.57 18.07 15.36 (250) 271
Net charge-off rate(3) ............................ 6.18 7.89 8.83 (171) (94)
Purchase volume(4) .............................. $12,754 $8,568 $8,502 49% 1%
December 31,
2011 2010 Change
Selected period-end data:
Loans held for investment ........................ $ 8,466 $7,522 13%
30+ day delinquency rate(5) ....................... 5.18% 5.75% (57)bps
Allowance for loan and lease losses ................ $ 472 $ 460 3%
(1) Average yield on loans held for investment is calculated by dividing interest income for the period by average loans held
for investment during the period. As indicated above, in preparing our Report on Form 10-Q for the first quarter of 2011,
we determined that beginning in the second quarter of 2010, our management accounting processes excluded certain
accounts that affected the calculation of the average yield on loans held for investment for our Credit Card business. The
previously reported average loan yield for our International Credit Card business was 16.33% in 2010.
(2) Revenue margin is calculated by dividing revenues for the period by average loans held for investment during the period
for the specified loan category.
(3) The net charge-off rate is calculated by dividing net charge-offs for the period by average loans held for investment
during the period for the specified loan category.
69