Capital One 2011 Annual Report Download - page 79
Download and view the complete annual report
Please find page 79 of the 2011 Capital One annual report below. You can navigate through the pages in the report by either clicking on the pages listed below, or by using the keyword search tool below to find specific information within the annual report.-
 1
1 -
 2
2 -
 3
3 -
 4
4 -
 5
5 -
 6
6 -
 7
7 -
 8
8 -
 9
9 -
 10
10 -
 11
11 -
 12
12 -
 13
13 -
 14
14 -
 15
15 -
 16
16 -
 17
17 -
 18
18 -
 19
19 -
 20
20 -
 21
21 -
 22
22 -
 23
23 -
 24
24 -
 25
25 -
 26
26 -
 27
27 -
 28
28 -
 29
29 -
 30
30 -
 31
31 -
 32
32 -
 33
33 -
 34
34 -
 35
35 -
 36
36 -
 37
37 -
 38
38 -
 39
39 -
 40
40 -
 41
41 -
 42
42 -
 43
43 -
 44
44 -
 45
45 -
 46
46 -
 47
47 -
 48
48 -
 49
49 -
 50
50 -
 51
51 -
 52
52 -
 53
53 -
 54
54 -
 55
55 -
 56
56 -
 57
57 -
 58
58 -
 59
59 -
 60
60 -
 61
61 -
 62
62 -
 63
63 -
 64
64 -
 65
65 -
 66
66 -
 67
67 -
 68
68 -
 69
69 -
 70
70 -
 71
71 -
 72
72 -
 73
73 -
 74
74 -
 75
75 -
 76
76 -
 77
77 -
 78
78 -
 79
79 -
 80
80 -
 81
81 -
 82
82 -
 83
83 -
 84
84 -
 85
85 -
 86
86 -
 87
87 -
 88
88 -
 89
89 -
 90
90 -
 91
91 -
 92
92 -
 93
93 -
 94
94 -
 95
95 -
 96
96 -
 97
97 -
 98
98 -
 99
99 -
 100
100 -
 101
101 -
 102
102 -
 103
103 -
 104
104 -
 105
105 -
 106
106 -
 107
107 -
 108
108 -
 109
109 -
 110
110 -
 111
111 -
 112
112 -
 113
113 -
 114
114 -
 115
115 -
 116
116 -
 117
117 -
 118
118 -
 119
119 -
 120
120 -
 121
121 -
 122
122 -
 123
123 -
 124
124 -
 125
125 -
 126
126 -
 127
127 -
 128
128 -
 129
129 -
 130
130 -
 131
131 -
 132
132 -
 133
133 -
 134
134 -
 135
135 -
 136
136 -
 137
137 -
 138
138 -
 139
139 -
 140
140 -
 141
141 -
 142
142 -
 143
143 -
 144
144 -
 145
145 -
 146
146 -
 147
147 -
 148
148 -
 149
149 -
 150
150 -
 151
151 -
 152
152 -
 153
153 -
 154
154 -
 155
155 -
 156
156 -
 157
157 -
 158
158 -
 159
159 -
 160
160 -
 161
161 -
 162
162 -
 163
163 -
 164
164 -
 165
165 -
 166
166 -
 167
167 -
 168
168 -
 169
169 -
 170
170 -
 171
171 -
 172
172 -
 173
173 -
 174
174 -
 175
175 -
 176
176 -
 177
177 -
 178
178 -
 179
179 -
 180
180 -
 181
181 -
 182
182 -
 183
183 -
 184
184 -
 185
185 -
 186
186 -
 187
187 -
 188
188 -
 189
189 -
 190
190 -
 191
191 -
 192
192 -
 193
193 -
 194
194 -
 195
195 -
 196
196 -
 197
197 -
 198
198 -
 199
199 -
 200
200 -
 201
201 -
 202
202 -
 203
203 -
 204
204 -
 205
205 -
 206
206 -
 207
207 -
 208
208 -
 209
209 -
 210
210 -
 211
211 -
 212
212 -
 213
213 -
 214
214 -
 215
215 -
 216
216 -
 217
217 -
 218
218 -
 219
219 -
 220
220 -
 221
221 -
 222
222 -
 223
223 -
 224
224 -
 225
225 -
 226
226 -
 227
227 -
 228
228 -
 229
229 -
 230
230 -
 231
231 -
 232
232 -
 233
233 -
 234
234 -
 235
235 -
 236
236 -
 237
237 -
 238
238 -
 239
239 -
 240
240 -
 241
241 -
 242
242 -
 243
243 -
 244
244 -
 245
245 -
 246
246 -
 247
247 -
 248
248 -
 249
249 -
 250
250 -
 251
251 -
 252
252 -
 253
253 -
 254
254 -
 255
255 -
 256
256 -
 257
257 -
 258
258 -
 259
259 -
 260
260 -
 261
261 -
 262
262 -
 263
263 -
 264
264 -
 265
265 -
 266
266 -
 267
267 -
 268
268 -
 269
269 -
 270
270 -
 271
271 -
 272
272 -
 273
273 -
 274
274 -
 275
275 -
 276
276 -
 277
277 -
 278
278 -
 279
279 -
 280
280 -
 281
281 -
 282
282 -
 283
283 -
 284
284 -
 285
285 -
 286
286 -
 287
287 -
 288
288 -
 289
289 -
 290
290 -
 291
291 -
 292
292 -
 293
293 -
 294
294 -
 295
295 -
 296
296 -
 297
297 -
 298
298
 |
 |

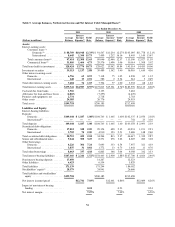
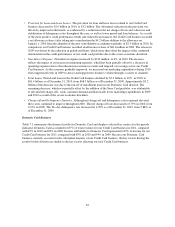
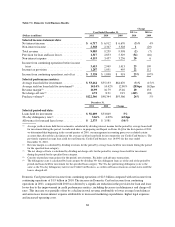
(1) Certain prior period amounts have been reclassified to conform to the current period presentation.
(2) Past due fees included in interest income on a managed basis totaled approximately $1.1 billion, $1.1 billion and $1.4
billion for 2011, 2010 and 2009, respectively.
(3) Interest income on credit card, auto, home and retail banking loans is reflected in consumer loans. Interest income
generated from small business credit cards also is included in consumer loans.
(4) In the first quarter of 2011, we revised previously reported interest income on interest-earning assets and average yield
on loans held for investment for 2010 to conform to the internal management accounting methodology used in our
segment reporting. The interest income and average loan yields presented reflect this revision. The previously reported
interest income and average yields for 2010 were as follows: domestic consumer loans ($11.5 billion and 12.51%); total
consumer loans ($12.7 billion and 12.79%); and commercial loans ($1.3 billion and 4.32%).
(5) The U.K. deposit business, which was included in international deposits, was sold during the third quarter of 2009.
(6) Includes a reduction of $2.9 billion recorded on January 1, 2010, in conjunction with the adoption of the new
consolidation accounting guidance.
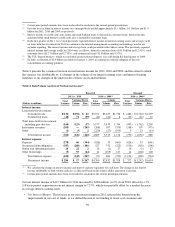
Table 4 presents the variances between our net interest income for 2011, 2010 and 2009, and the extent to which
the variance was attributable to: (i) changes in the volume of our interest-earning assets and interest-bearing
liabilities or (ii) changes in the interest rates of these assets and liabilities.
Table 4: Rate/Volume Analysis of Net Interest Income(1)
Reported Managed
2011 vs. 2010 2010 vs. 2009(2) 2010 vs. 2009(2)
Total
Variance
Variance Due to Total
Variance
Volume Total
Variance
Variance Due to
(Dollars in millions) Volume Rate Volume Rate Volume Rate
Interest income:
Loans held-for-investment:
Consumer loans ......... $(132) $(194) $ 62 $5,191 $3,455 $1,736 $ (481) $(1,740) $1,259
Commercial loans ........ (28) 71 (99) (14) (22) 8 (12) (22) 10
Total loans held for investment,
including past-due fees ...... (160) (123) (37) 5,177 3,433 1,744 (493) (1,762) 1,269
Investment securities ......... (205) — (205) (268) 107 (375) (268) 107 (375)
Other ...................... (1) (3) 2 (220) (27) (193) 9 23 (14)
Total interest income ..... (366) (126) (240) 4,689 3,513 1,176 (752) (1,632) 880
Interest expense:
Deposits ................... (278) 66 (344) (628) 33 (661) (628) 33 (661)
Securitized debt obligations .... (387) (286) (101) 527 752 (225) (526) (318) (208)
Senior and subordinated notes . . 24 22 2 16 (1) 17 16 (1) 17
Other borrowings ............ (9) 55 (64) 14 (103) 117 14 (104) 118
Total interest expense ..... (650) (143) (507) (71) 681 (752) (1,124) (390) (734)
Net interest income ....... $ 284 $ 17 $ 267 $4,760 $2,832 $1,928 $ 372 $(1,242) $1,614
(1) We calculate the change in interest income and interest expense separately for each item. The change in net interest
income attributable to both volume and rates is allocated based on the relative dollar amount of each item.
(2) Certain prior period amounts have been reclassified to conform to the current period presentation.
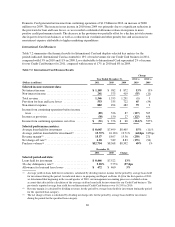
Our net interest income of $12.7 billion for 2011 increased by $284 million, or 2%, from 2010, driven by a 3%
(18 basis points) expansion in our net interest margin to 7.27%, which was partially offset by a modest decrease
in average interest-earning assets.
•Net Interest Margin: The increase in our net interest margin in 2011 reflected the benefit from the
improvement in our cost of funds, as we shifted the mix of our funding to lower cost consumer and
59
