Capital One 2011 Annual Report Download - page 97
Download and view the complete annual report
Please find page 97 of the 2011 Capital One annual report below. You can navigate through the pages in the report by either clicking on the pages listed below, or by using the keyword search tool below to find specific information within the annual report.-
 1
1 -
2
-
3
-
4
-
5
-
6
-
7
-
8
-
9
-
10
-
11
-
12
-
13
-
14
-
15
-
16
-
17
-
18
-
19
-
20
-
21
-
22
-
23
-
24
-
25
-
26
-
27
-
28
-
29
-
30
-
31
-
32
-
33
-
34
-
35
-
36
-
37
-
38
-
39
-
40
-
41
-
42
-
43
-
44
-
45
-
46
-
47
-
48
-
49
-
50
-
51
-
52
-
53
-
54
-
55
-
56
-
57
-
58
-
59
-
60
-
61
-
62
-
63
-
64
-
65
-
66
-
67
-
68
-
69
-
70
-
71
-
72
-
73
-
74
-
75
-
76
-
77
-
78
-
79
-
80
-
81
-
82
-
83
-
84
-
85
-
86
-
 87
87 -
 88
88 -
 89
89 -
 90
90 -
 91
91 -
 92
92 -
 93
93 -
 94
94 -
 95
95 -
 96
96 -
 97
97 -
 98
98 -
 99
99 -
 100
100 -
 101
101 -
 102
102 -
 103
103 -
 104
104 -
 105
105 -
 106
106 -
 107
107 -
108
-
109
-
110
-
111
-
112
-
113
-
114
-
115
-
116
-
117
-
118
-
119
-
120
-
121
-
122
-
123
-
124
-
125
-
126
-
127
-
128
-
129
-
130
-
131
-
132
-
133
-
134
-
135
-
136
-
137
-
138
-
139
-
140
-
141
-
142
-
143
-
144
-
145
-
146
-
147
-
148
-
149
-
150
-
151
-
152
-
153
-
154
-
155
-
156
-
157
-
158
-
159
-
160
-
161
-
162
-
163
-
164
-
165
-
166
-
167
-
168
-
169
-
170
-
171
-
172
-
173
-
174
-
175
-
176
-
177
-
178
-
179
-
180
-
181
-
182
-
183
-
184
-
185
-
186
-
187
-
188
-
189
-
190
-
191
-
192
-
193
-
194
-
195
-
196
-
197
-
198
-
199
-
200
-
201
-
202
-
203
-
204
-
205
-
206
-
207
-
208
-
209
-
210
-
211
-
212
-
213
-
214
-
215
-
216
-
217
-
218
-
219
-
220
-
221
-
222
-
223
-
224
-
225
-
226
-
227
-
228
-
229
-
230
-
231
-
232
-
233
-
234
-
235
-
236
-
237
-
238
-
239
-
240
-
241
-
242
-
243
-
244
-
245
-
246
-
247
-
248
-
249
-
250
-
251
-
252
-
253
-
254
-
255
-
256
-
257
-
258
-
259
-
260
-
261
-
262
-
263
-
264
-
265
-
266
-
267
-
268
-
269
-
270
-
271
-
272
-
273
-
274
-
275
-
276
-
277
-
278
-
279
-
280
-
281
-
282
-
283
-
284
-
285
-
286
-
287
-
288
-
289
-
290
-
291
-
292
-
293
-
294
-
295
-
296
-
297
-
298
 |
 |

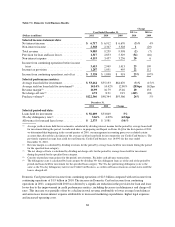
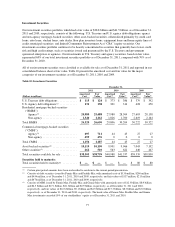
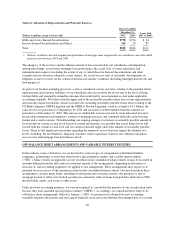
Investment Securities
Our investment securities portfolio, which had a fair value of $38.8 billion and $41.5 billion, as of December 31,
2011 and 2010, respectively, consists of the following: U.S. Treasury and U.S. agency debt obligations; agency
and non-agency mortgage-backed securities; other asset-backed securities collateralized primarily by credit card
loans, auto loans, student loans, auto dealer floor plan inventory loans, equipment loans and home equity lines of
credit; municipal securities; and limited Community Reinvestment Act (“CRA”) equity securities. Our
investment securities portfolio continues to be heavily concentrated in securities that generally have lower credit
risk and high credit ratings, such as securities issued and guaranteed by the U.S. Treasury and government
sponsored enterprises or agencies. Our investments in U.S. Treasury and agency securities, based on fair value,
represented 69% of our total investment securities portfolio as of December 31, 2011, compared with 70% as of
December 31, 2010.
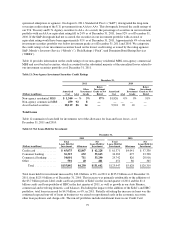
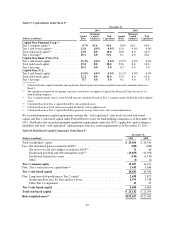
All of our investment securities were classified as available for sale as of December 31, 2011 and reported in our
consolidated balance sheet at fair value. Table 10 presents the amortized cost and fair value for the major
categories of our investment securities as of December 31, 2011, 2010 and 2009.
Table 10: Investment Securities
December 31,
2011 2010 2009
(Dollars in millions)
Amortized
Cost
Fair
Value
Amortized
Cost(1)
Fair
Value(1)
Amortized
Cost(1)
Fair
Value(1)
U.S. Treasury debt obligations ............. $ 115 $ 124 $ 373 $ 386 $ 379 $ 392
U.S. Agency debt obligations(2) ............ 131 138 301 314 428 450
Residential mortgage-backed securities
(“RMBS”):
Agency(3) .......................... 24,980 25,488 27,980 28,504 27,603 28,158
Non-agency ........................ 1,340 1,162 1,826 1,700 2,619 2,164
Total RMBS ........................... 26,320 26,650 29,806 30,204 30,222 30,322
Commercial mortgage-backed securities
(“CMBS”):
Agency(3) ......................... 697 711 44 45 27 27
Non-agency ........................ 459 476 0000
Total CMBS ........................... 1,156 1,187 44 45 27 27
Asset-backed securities(4) ................. 10,119 10,150 9,901 9,966 7,043 7,192
Other securities(5) ....................... 462 510 563 622 440 447
Total securities available for sale ........... $38,303 $38,759 $40,988 $41,537 $38,539 $38,830
Securities held to maturity:
Total securities held to maturity(6) .......... $— $— $ — $ — $ 80 $ 80
(1) Certain prior period amounts have been reclassified to conform to the current period presentation.
(2) Consists of debt securities issued by Fannie Mae and Freddie Mac with amortized costs of $130 million, $200 million
and $454 million, as of December 31, 2011, 2010 and 2009, respectively, and fair values of $137 million, $213 million
and $476 million, as of December 31, 2011, 2010 and 2009, respectively.
(3) Consists of MBS issued by Fannie Mae, Freddie Mac and Ginnie Mae with amortized costs of $12.3 billion, $8.9 billion
and $4.5 billion and $17.1 billion, $8.1 billion and $2.9 billion, respectively, as of December 31, 2011 and 2010,
respectively, and fair values of $12.6 billion, $9.1 billion and $4.5 billion and $17.3 billion, $8.3 billion and $3.0 billion,
respectively, as of December 31, 2011 and 2010, respectively. The book value of Fannie Mae, Freddie Mac and Ginnie
Mae investments exceeded 10% of our stockholders’ equity as of December 31, 2011 and 2010.
77