Capital One 2011 Annual Report Download - page 256
Download and view the complete annual report
Please find page 256 of the 2011 Capital One annual report below. You can navigate through the pages in the report by either clicking on the pages listed below, or by using the keyword search tool below to find specific information within the annual report.-
 1
1 -
2
-
3
-
4
-
5
-
6
-
7
-
8
-
9
-
10
-
11
-
12
-
13
-
14
-
15
-
16
-
17
-
18
-
19
-
20
-
21
-
22
-
23
-
24
-
25
-
26
-
27
-
28
-
29
-
30
-
31
-
32
-
33
-
34
-
35
-
36
-
37
-
38
-
39
-
40
-
41
-
42
-
43
-
44
-
45
-
46
-
47
-
48
-
49
-
50
-
51
-
52
-
53
-
54
-
55
-
56
-
57
-
58
-
59
-
60
-
61
-
62
-
63
-
64
-
65
-
66
-
67
-
68
-
69
-
70
-
71
-
72
-
73
-
74
-
75
-
76
-
77
-
78
-
79
-
80
-
81
-
82
-
83
-
84
-
85
-
86
-
87
-
88
-
89
-
90
-
91
-
92
-
93
-
94
-
95
-
96
-
97
-
98
-
99
-
100
-
101
-
102
-
103
-
104
-
105
-
106
-
107
-
108
-
109
-
110
-
111
-
112
-
113
-
114
-
115
-
116
-
117
-
118
-
119
-
120
-
121
-
122
-
123
-
124
-
125
-
126
-
127
-
128
-
129
-
130
-
131
-
132
-
133
-
134
-
135
-
136
-
137
-
138
-
139
-
140
-
141
-
142
-
143
-
144
-
145
-
146
-
147
-
148
-
149
-
150
-
151
-
152
-
153
-
154
-
155
-
156
-
157
-
158
-
159
-
160
-
161
-
162
-
163
-
164
-
165
-
166
-
167
-
168
-
169
-
170
-
171
-
172
-
173
-
174
-
175
-
176
-
177
-
178
-
179
-
180
-
181
-
182
-
183
-
184
-
185
-
186
-
187
-
188
-
189
-
190
-
191
-
192
-
193
-
194
-
195
-
196
-
197
-
198
-
199
-
200
-
201
-
202
-
203
-
204
-
205
-
206
-
207
-
208
-
209
-
210
-
211
-
212
-
213
-
214
-
215
-
216
-
217
-
218
-
219
-
220
-
221
-
222
-
223
-
224
-
225
-
226
-
227
-
228
-
229
-
230
-
231
-
232
-
233
-
234
-
235
-
236
-
237
-
238
-
239
-
240
-
241
-
242
-
243
-
244
-
245
-
 246
246 -
 247
247 -
 248
248 -
 249
249 -
 250
250 -
 251
251 -
 252
252 -
 253
253 -
 254
254 -
 255
255 -
 256
256 -
 257
257 -
 258
258 -
 259
259 -
 260
260 -
 261
261 -
 262
262 -
 263
263 -
 264
264 -
 265
265 -
 266
266 -
267
-
268
-
269
-
270
-
271
-
272
-
273
-
274
-
275
-
276
-
277
-
278
-
279
-
280
-
281
-
282
-
283
-
284
-
285
-
286
-
287
-
288
-
289
-
290
-
291
-
292
-
293
-
294
-
295
-
296
-
297
-
298
 |
 |
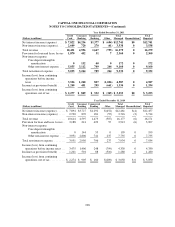
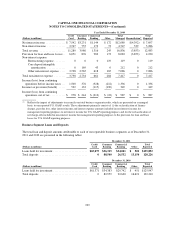
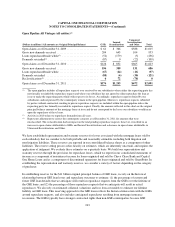
CAPITAL ONE FINANCIAL CORPORATION
NOTES TO CONSOLIDATED STATEMENTS—(Continued)
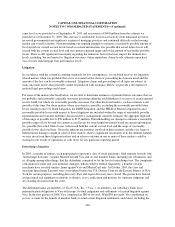
business segments. Accordingly, net gains and losses on our investment securities portfolio and certain
trading activities are included in the Other category. The Other category also includes foreign exchange-rate
fluctuations related to the revaluation of foreign currency-denominated investments; certain gains (losses)
on the sale and securitization of loans; unallocated corporate expenses that do not directly support the
operations of the business segments or for which the business segments are not considered financially
accountable in evaluating their performance, such as acquisition and restructuring charges; provisions for
representation and warranty reserves related to continuing operations; certain material items that are
non-recurring in nature; and offsets related to certain line-item reclassifications.
Basis of Presentation
We report the financial results of our business segments on a continuing operations basis. See “Note 3—
Discontinued Operations” for a discussion of discontinued operations. The results of our individual businesses,
which are prepared on an internal management accounting and reporting basis, reflect the manner in which
management evaluates performance and makes decisions about funding our operations and allocating
resources. We refer to the business segment results derived from our internal management accounting and
reporting process as our “managed” presentation, which differs in some cases from our reported results prepared
based on U.S. GAAP. There is no comprehensive, authoritative body of guidance for management accounting
equivalent to U.S. GAAP; therefore, the managed basis presentation of our business segment results may not be
comparable to similar information provided by other financial service companies. In addition, our individual
business segment results should not be used as a substitute for comparable results determined in accordance with
U.S. GAAP.
Prior to January 1, 2010, our managed-basis presentation assumed that our securitized loans had not been sold
and that the earnings from securitized loans were classified in our results of operations in the same manner as the
earnings on loans that we owned. Our managed results also reflected differences in accounting for the valuation
of retained interests and the recognition of gains and losses on the sale of interest-only strips. Our managed
results did not include the addition of an allowance for loan and lease losses for the loans underlying our
off-balance sheet securitization trusts. The adoption on January 1, 2010 of the new consolidation accounting
standards resulted in accounting for the loans in our securitization trusts in our reported financial statements in a
manner similar to how we account for these loans on a managed basis. As a result, our total reported and
managed basis presentations are generally comparable for periods beginning after January 1, 2010.
We may periodically change our business segments or reclassify business segment results based on modifications
to our management reporting methodologies and changes in organizational alignment.
Business Segment Reporting Methodology
The results of our business segments are intended to reflect each segment as if it were a stand-alone business. We
have developed allocation methods for use in our internal management accounting and reporting process to
assign certain managed balance sheet assets, deposits and other liabilities and their related revenue and expenses
directly or indirectly attributable to each business segment. These allocation methods include funds transfer
pricing and various other internally-developed methodologies and assumptions management believes are
appropriate to reflect the results of each business segment. Due to the integrated nature of our business segments,
estimates and judgments have been made in allocating certain revenue and expense items. Transactions between
segments are based on specific criteria or approximate third-party rates. We regularly assess the assumptions,
methodologies and reporting classifications used for segment reporting, which may result in the implementation
of refinements or changes in future periods.
236