Capital One 2011 Annual Report Download - page 257
Download and view the complete annual report
Please find page 257 of the 2011 Capital One annual report below. You can navigate through the pages in the report by either clicking on the pages listed below, or by using the keyword search tool below to find specific information within the annual report.-
 1
1 -
2
-
3
-
4
-
5
-
6
-
7
-
8
-
9
-
10
-
11
-
12
-
13
-
14
-
15
-
16
-
17
-
18
-
19
-
20
-
21
-
22
-
23
-
24
-
25
-
26
-
27
-
28
-
29
-
30
-
31
-
32
-
33
-
34
-
35
-
36
-
37
-
38
-
39
-
40
-
41
-
42
-
43
-
44
-
45
-
46
-
47
-
48
-
49
-
50
-
51
-
52
-
53
-
54
-
55
-
56
-
57
-
58
-
59
-
60
-
61
-
62
-
63
-
64
-
65
-
66
-
67
-
68
-
69
-
70
-
71
-
72
-
73
-
74
-
75
-
76
-
77
-
78
-
79
-
80
-
81
-
82
-
83
-
84
-
85
-
86
-
87
-
88
-
89
-
90
-
91
-
92
-
93
-
94
-
95
-
96
-
97
-
98
-
99
-
100
-
101
-
102
-
103
-
104
-
105
-
106
-
107
-
108
-
109
-
110
-
111
-
112
-
113
-
114
-
115
-
116
-
117
-
118
-
119
-
120
-
121
-
122
-
123
-
124
-
125
-
126
-
127
-
128
-
129
-
130
-
131
-
132
-
133
-
134
-
135
-
136
-
137
-
138
-
139
-
140
-
141
-
142
-
143
-
144
-
145
-
146
-
147
-
148
-
149
-
150
-
151
-
152
-
153
-
154
-
155
-
156
-
157
-
158
-
159
-
160
-
161
-
162
-
163
-
164
-
165
-
166
-
167
-
168
-
169
-
170
-
171
-
172
-
173
-
174
-
175
-
176
-
177
-
178
-
179
-
180
-
181
-
182
-
183
-
184
-
185
-
186
-
187
-
188
-
189
-
190
-
191
-
192
-
193
-
194
-
195
-
196
-
197
-
198
-
199
-
200
-
201
-
202
-
203
-
204
-
205
-
206
-
207
-
208
-
209
-
210
-
211
-
212
-
213
-
214
-
215
-
216
-
217
-
218
-
219
-
220
-
221
-
222
-
223
-
224
-
225
-
226
-
227
-
228
-
229
-
230
-
231
-
232
-
233
-
234
-
235
-
236
-
237
-
238
-
239
-
240
-
241
-
242
-
243
-
244
-
245
-
246
-
 247
247 -
 248
248 -
 249
249 -
 250
250 -
 251
251 -
 252
252 -
 253
253 -
 254
254 -
 255
255 -
 256
256 -
 257
257 -
 258
258 -
 259
259 -
 260
260 -
 261
261 -
 262
262 -
 263
263 -
 264
264 -
 265
265 -
 266
266 -
 267
267 -
268
-
269
-
270
-
271
-
272
-
273
-
274
-
275
-
276
-
277
-
278
-
279
-
280
-
281
-
282
-
283
-
284
-
285
-
286
-
287
-
288
-
289
-
290
-
291
-
292
-
293
-
294
-
295
-
296
-
297
-
298
 |
 |
CAPITAL ONE FINANCIAL CORPORATION
NOTES TO CONSOLIDATED STATEMENTS—(Continued)
Following is a description of the principles and methodologies used in preparing our business segment results.
•Net interest income: Interest income from loans held for investment and interest expense from deposits and
other interest-bearing liabilities are reflected within each applicable business segment. Because funding and
asset/liability management are managed centrally by our Corporate Treasury Group, net interest income for
our business segments also includes the results of a funds transfer pricing process that is intended to allocate
a cost of funds used or credit for funds provided to all business segment assets and liabilities, respectively,
using a matched funding concept. Also, taxable-equivalent benefit of tax-exempt products is allocated to
each business unit with a corresponding increase in income tax expense.
•Non-interest income: Non-interest fees and other revenue associated with loans or customers managed by
each business segment and other direct revenues are accounted for within each business segment.
•Provision for loan and lease losses: The provisions for loan and lease losses are directly attributable to the
business segment in which the loans are managed.
•Non-interest expense: Non-interest expenses directly managed and incurred by a business segment are
accounted for within each business segment. We allocate certain non-interest expenses indirectly incurred
by business segments, such as corporate support functions, to each business segment based on various
factors, including the actual cost of the services from the service providers, the utilization of the services,
the number of employees or other relevant factors.
•Goodwill and other intangible assets: Goodwill and other intangible assets are assigned to business
segments based on the relative fair value of each segment. Intangible amortization is included in the results
of the applicable segment.
•Income taxes: Income taxes are assessed for each business segment based on a standard tax rate with the
residual tax expense or benefit to arrive at the consolidated effective tax rate included in the Other category.
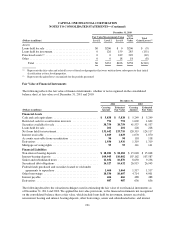
•Loans held for investment: Loans are reported within each business segment based on product or customer
type.
•Deposits: Deposits are reported within each business segment based on product or customer type.
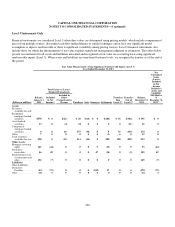
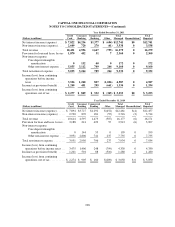
Segment Results and Reconciliation
The following tables provide a summary of our business segment results for the years ended December 31, 2011,
2010 and 2009 and selected balance sheet data as of December 31, 2011 and 2010. Total consolidated assets are
not allocated among our business segments in the information that is reviewed by our chief operating decision
maker. The total of our business segment results and “Other” category, or “Total Managed,” differs from our
total consolidated reported results. The impact of these differences is reflected in the “Reconciliation”
category. The securitization adjustments remove the impact of presenting off-balance sheet securitized loans in
our business segment results in the same manner as on-balance sheet loans to reconcile to our total consolidated
reported results.
We may periodically change our business segments or reclassify business segment results based on modifications
to our management reporting methodologies and changes in organizational alignment.
237