Capital One 2011 Annual Report Download - page 148
Download and view the complete annual report
Please find page 148 of the 2011 Capital One annual report below. You can navigate through the pages in the report by either clicking on the pages listed below, or by using the keyword search tool below to find specific information within the annual report.-
 1
1 -
2
-
3
-
4
-
5
-
6
-
7
-
8
-
9
-
10
-
11
-
12
-
13
-
14
-
15
-
16
-
17
-
18
-
19
-
20
-
21
-
22
-
23
-
24
-
25
-
26
-
27
-
28
-
29
-
30
-
31
-
32
-
33
-
34
-
35
-
36
-
37
-
38
-
39
-
40
-
41
-
42
-
43
-
44
-
45
-
46
-
47
-
48
-
49
-
50
-
51
-
52
-
53
-
54
-
55
-
56
-
57
-
58
-
59
-
60
-
61
-
62
-
63
-
64
-
65
-
66
-
67
-
68
-
69
-
70
-
71
-
72
-
73
-
74
-
75
-
76
-
77
-
78
-
79
-
80
-
81
-
82
-
83
-
84
-
85
-
86
-
87
-
88
-
89
-
90
-
91
-
92
-
93
-
94
-
95
-
96
-
97
-
98
-
99
-
100
-
101
-
102
-
103
-
104
-
105
-
106
-
107
-
108
-
109
-
110
-
111
-
112
-
113
-
114
-
115
-
116
-
117
-
118
-
119
-
120
-
121
-
122
-
123
-
124
-
125
-
126
-
127
-
128
-
129
-
130
-
131
-
132
-
133
-
134
-
135
-
136
-
137
-
 138
138 -
 139
139 -
 140
140 -
 141
141 -
 142
142 -
 143
143 -
 144
144 -
 145
145 -
 146
146 -
 147
147 -
 148
148 -
 149
149 -
 150
150 -
 151
151 -
 152
152 -
 153
153 -
 154
154 -
 155
155 -
 156
156 -
 157
157 -
 158
158 -
159
-
160
-
161
-
162
-
163
-
164
-
165
-
166
-
167
-
168
-
169
-
170
-
171
-
172
-
173
-
174
-
175
-
176
-
177
-
178
-
179
-
180
-
181
-
182
-
183
-
184
-
185
-
186
-
187
-
188
-
189
-
190
-
191
-
192
-
193
-
194
-
195
-
196
-
197
-
198
-
199
-
200
-
201
-
202
-
203
-
204
-
205
-
206
-
207
-
208
-
209
-
210
-
211
-
212
-
213
-
214
-
215
-
216
-
217
-
218
-
219
-
220
-
221
-
222
-
223
-
224
-
225
-
226
-
227
-
228
-
229
-
230
-
231
-
232
-
233
-
234
-
235
-
236
-
237
-
238
-
239
-
240
-
241
-
242
-
243
-
244
-
245
-
246
-
247
-
248
-
249
-
250
-
251
-
252
-
253
-
254
-
255
-
256
-
257
-
258
-
259
-
260
-
261
-
262
-
263
-
264
-
265
-
266
-
267
-
268
-
269
-
270
-
271
-
272
-
273
-
274
-
275
-
276
-
277
-
278
-
279
-
280
-
281
-
282
-
283
-
284
-
285
-
286
-
287
-
288
-
289
-
290
-
291
-
292
-
293
-
294
-
295
-
296
-
297
-
298
 |
 |

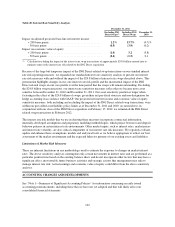
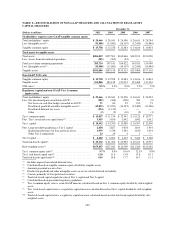
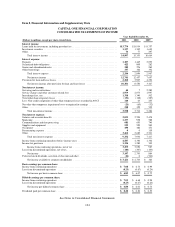
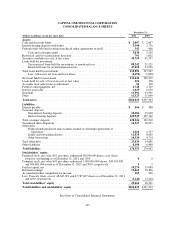
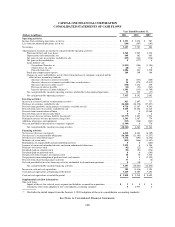
TABLE E—SUMMARY OF ALLOWANCE FOR LOAN AND LEASE LOSSES
December 31,
(Dollars in millions) 2011 2010 2009 2008 2007
Balance as of beginning of period, as reported ............. $ 5,628 $ 4,127 $ 4,524 $ 2,963 $ 2,180
Impact from January 1, 2010 adoption of new consolidation
accounting standards ............................... —4,317(1) ———
Balance at beginning of period, as adjusted ............... 5,628 8,444 4,524 2,963 2,180
Provision for loan and lease losses(2)(3) .................. 2,401 3,895 4,230 5,101 2,717
Charge-offs:
Domestic credit card and installment(3) ............... (3,558) (6,020) (3,050) (2,244) (1,315)
International credit card and installment .............. (752) (761) (284) (255) (253)
Consumer banking ............................... (732) (898) (1,357) (1,396) (965)
Commercial banking ............................. (214) (444) (444) (87) (17)
Other loans ..................................... (59) (115) (207) (169) (31)
Total charge-offs .................................... (5,315) (8,238) (5,342) (4,151) (2,581)
Recoveries:
Domestic credit card and installment ................ 1,036 1,113 447 425 393
International credit card and installment .............. 218 169 52 65 72
Consumer banking ............................... 248 243 263 178 151
Commercial banking ............................. 37 54 10 4 4
Other loans ..................................... 5821—
Total recoveries ..................................... 1,544 1,587 774 673 620
Net charge-offs (3,771) (6,651) (4,568) (3,478) (1,961)
Impact from acquisitions, sales and other changes(4) ........ (8) (60) (59) (62) 27
Balance as of end of period ............................ $ 4,250 $ 5,628 $ 4,127 $ 4,524 $ 2,963
Allowance for loan and lease losses as a percentage of loans
held for investment ................................ 3.13% 4.47% 4.55% 4.48% 2.91%
Allowance for loan and lease losses by geographic
distribution:
Domestic ...................................... $ 3,778 $ 5,168 $ 3,928 $ 4,331 $ 2,754
International .................................... 472 460 199 193 209
Total .............................................. $ 4,250 $ 5,628 $ 4,127 $ 4,524 $ 2,963
Allowance for loan and lease losses by loan category:
Domestic card .................................. $ 2,375 $ 3,581 $ 1,927 $ 2,544 $ 1,429
International card ................................ 472 460 199 193 209
Consumer banking ............................... 652 675 1,076 1,314 1,005
Commercial banking ............................. 711 826 785 301 153
Other ......................................... 40 86 140 172 167
Total .............................................. $ 4,250 $ 5,628 $ 4,127 $ 4,524 $ 2,963
(1) Includes an adjustment of $53 million made in the second quarter of 2010 for the impact as of January 1, 2010 of
impairment on consolidated loans accounted for as TDRs.
(2) Excludes a negative provision for unfunded lending commitments of $41 million and a provision for unfunded lending
commitments of $12 million for 2011 and 2010, respectively.
(3) The reduction in the provision for loan and lease losses attributable to Kohl’s was $257 million for 2011. Loss sharing
amounts attributable to Kohl’s reduced charge-offs by $118 million in 2011. The expected reimbursement from Kohl’s
netted in our allowance for loan and lease losses was approximately $139 million as of December 31, 2011.
(4) Includes a reduction in our allowance for loan and lease losses of $73 million during the first quarter of 2010 attributable
to the sale of certain interest-only option-ARM bonds and the deconsolidation of the related securitization trusts related
to Chevy Chase Bank in the first quarter of 2010.
128