Capital One 2011 Annual Report Download - page 80
Download and view the complete annual report
Please find page 80 of the 2011 Capital One annual report below. You can navigate through the pages in the report by either clicking on the pages listed below, or by using the keyword search tool below to find specific information within the annual report.-
 1
1 -
2
-
3
-
4
-
5
-
6
-
7
-
8
-
9
-
10
-
11
-
12
-
13
-
14
-
15
-
16
-
17
-
18
-
19
-
20
-
21
-
22
-
23
-
24
-
25
-
26
-
27
-
28
-
29
-
30
-
31
-
32
-
33
-
34
-
35
-
36
-
37
-
38
-
39
-
40
-
41
-
42
-
43
-
44
-
45
-
46
-
47
-
48
-
49
-
50
-
51
-
52
-
53
-
54
-
55
-
56
-
57
-
58
-
59
-
60
-
61
-
62
-
63
-
64
-
65
-
66
-
67
-
68
-
69
-
 70
70 -
 71
71 -
 72
72 -
 73
73 -
 74
74 -
 75
75 -
 76
76 -
 77
77 -
 78
78 -
 79
79 -
 80
80 -
 81
81 -
 82
82 -
 83
83 -
 84
84 -
 85
85 -
 86
86 -
 87
87 -
 88
88 -
 89
89 -
 90
90 -
91
-
92
-
93
-
94
-
95
-
96
-
97
-
98
-
99
-
100
-
101
-
102
-
103
-
104
-
105
-
106
-
107
-
108
-
109
-
110
-
111
-
112
-
113
-
114
-
115
-
116
-
117
-
118
-
119
-
120
-
121
-
122
-
123
-
124
-
125
-
126
-
127
-
128
-
129
-
130
-
131
-
132
-
133
-
134
-
135
-
136
-
137
-
138
-
139
-
140
-
141
-
142
-
143
-
144
-
145
-
146
-
147
-
148
-
149
-
150
-
151
-
152
-
153
-
154
-
155
-
156
-
157
-
158
-
159
-
160
-
161
-
162
-
163
-
164
-
165
-
166
-
167
-
168
-
169
-
170
-
171
-
172
-
173
-
174
-
175
-
176
-
177
-
178
-
179
-
180
-
181
-
182
-
183
-
184
-
185
-
186
-
187
-
188
-
189
-
190
-
191
-
192
-
193
-
194
-
195
-
196
-
197
-
198
-
199
-
200
-
201
-
202
-
203
-
204
-
205
-
206
-
207
-
208
-
209
-
210
-
211
-
212
-
213
-
214
-
215
-
216
-
217
-
218
-
219
-
220
-
221
-
222
-
223
-
224
-
225
-
226
-
227
-
228
-
229
-
230
-
231
-
232
-
233
-
234
-
235
-
236
-
237
-
238
-
239
-
240
-
241
-
242
-
243
-
244
-
245
-
246
-
247
-
248
-
249
-
250
-
251
-
252
-
253
-
254
-
255
-
256
-
257
-
258
-
259
-
260
-
261
-
262
-
263
-
264
-
265
-
266
-
267
-
268
-
269
-
270
-
271
-
272
-
273
-
274
-
275
-
276
-
277
-
278
-
279
-
280
-
281
-
282
-
283
-
284
-
285
-
286
-
287
-
288
-
289
-
290
-
291
-
292
-
293
-
294
-
295
-
296
-
297
-
298
 |
 |
commercial banking deposits from higher cost wholesale sources and the decline in deposit interest rates as
a result of the overall interest rate environment. The decrease in yield on interest-earning assets was
attributable to the addition of the Kohl’s portfolio. Under our partnership agreement with Kohl’s, we share a
fixed percentage of revenues, consisting of finance charges and late fees. We report revenues related to
Kohl’s credit card loans on a net basis in our consolidated financial statements, which has the effect of
reducing the yield on our average interest-earning assets. The impact of these factors was partially offset by
the run-off of lower margin installment loans, a reduced level of new accounts with low introductory
promotional rates, and an increase in the recognition of billed finance charges and fees due to the
improvement in credit performance as well as the change we made in the third quarter of 2011 in our
estimation of non-principal recoveries used in determining our uncollectible finance charge and fee reserve.
•Average Interest-Earning Assets: The decrease in average interest-earning assets in 2011 reflected the
continued run-off of businesses that we exited or repositioned, including our installment, home loan and
small-ticket commercial real estate loan portfolios, which were slightly offset by the impact of modest
revolving credit card loan growth and the addition of the existing HBC credit card loan portfolio of $1.4
billion in the first quarter of 2011 and the addition of the existing Kohl’s private-label credit card loan
portfolio of $3.7 billion in the second quarter of 2011.
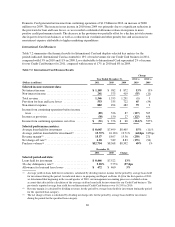
Our reported net interest income of $12.5 billion in 2010 increased by $368 million, or 3%, from managed net
interest income of $12.1 billion in 2009 driven by a 9% (59 basis points) expansion in of our net interest margin
to 7.09%, which was partially offset by a 5% decrease in average interest-earning assets.
•Net Interest Margin: The increase in net interest margin in 2010 was primarily attributable to a significant
reduction in our average cost of funds, coupled with an increase in the average yield on interest-earning
assets. Our cost of funds continued to benefit from the shift in the mix of our funding to lower cost
consumer and commercial banking deposits from higher cost wholesale sources. Also, the overall interest
rate environment, combined with our disciplined pricing, drove a decrease in our average deposit interest
rates. The increase in the average yield on our interest-earning assets during 2010 reflected the benefit of
pricing changes that we implemented during 2009, which contributed to an increase in the average yield on
our loan portfolio, as well as improved credit conditions, which has allowed us to recognize a greater
proportion of previously reserved uncollected finance charges into income.
•Average Interest-Earning Assets: The decrease in average interest-earning assets resulted from the run-off
of loans in businesses that we exited or repositioned, elevated charge-offs and weak consumer demand.
Non-Interest Income
Non-interest income primarily consists of service charges and other customer-related fees, interchange income
(net of rewards expense) and other non-interest income. The servicing fees, finance charges, other fees, net of
charge-offs and interest paid to third party investors related to our consolidated securitization trusts are reported
as a component of non-interest income. Prior to the adoption of the new consolidation accounting standards on
January 1, 2010, our reported non-interest income included servicing fees, finance charges, other fees, net
charge-offs and interest paid to third party investors related to our securitization trusts as a component of
non-interest income. In addition, when we created securitization trusts, we recognized gains or losses on the
transfer of loans to these trusts and recorded our initial retained interests in the trusts. Effective January 1, 2010,
unless we qualify for sale accounting under the new consolidation accounting standards, we no longer recognize
a gain or loss or record retained interests when we transfer loans into securitization trusts. The servicing fees,
finance charges, other fees, net of charge-offs and interest paid to third party investors related to our consolidated
securitization trusts are now reported as a component of net interest income instead of as a component of
non-interest income.
We also record the provision for mortgage repurchase losses related to continuing operations in non-interest
income. The “other” component of non-interest income includes gains and losses on derivatives not accounted
60