Capital One 2011 Annual Report Download - page 132
Download and view the complete annual report
Please find page 132 of the 2011 Capital One annual report below. You can navigate through the pages in the report by either clicking on the pages listed below, or by using the keyword search tool below to find specific information within the annual report.-
 1
1 -
2
-
3
-
4
-
5
-
6
-
7
-
8
-
9
-
10
-
11
-
12
-
13
-
14
-
15
-
16
-
17
-
18
-
19
-
20
-
21
-
22
-
23
-
24
-
25
-
26
-
27
-
28
-
29
-
30
-
31
-
32
-
33
-
34
-
35
-
36
-
37
-
38
-
39
-
40
-
41
-
42
-
43
-
44
-
45
-
46
-
47
-
48
-
49
-
50
-
51
-
52
-
53
-
54
-
55
-
56
-
57
-
58
-
59
-
60
-
61
-
62
-
63
-
64
-
65
-
66
-
67
-
68
-
69
-
70
-
71
-
72
-
73
-
74
-
75
-
76
-
77
-
78
-
79
-
80
-
81
-
82
-
83
-
84
-
85
-
86
-
87
-
88
-
89
-
90
-
91
-
92
-
93
-
94
-
95
-
96
-
97
-
98
-
99
-
100
-
101
-
102
-
103
-
104
-
105
-
106
-
107
-
108
-
109
-
110
-
111
-
112
-
113
-
114
-
115
-
116
-
117
-
118
-
119
-
120
-
121
-
 122
122 -
 123
123 -
 124
124 -
 125
125 -
 126
126 -
 127
127 -
 128
128 -
 129
129 -
 130
130 -
 131
131 -
 132
132 -
 133
133 -
 134
134 -
 135
135 -
 136
136 -
 137
137 -
 138
138 -
 139
139 -
 140
140 -
 141
141 -
 142
142 -
143
-
144
-
145
-
146
-
147
-
148
-
149
-
150
-
151
-
152
-
153
-
154
-
155
-
156
-
157
-
158
-
159
-
160
-
161
-
162
-
163
-
164
-
165
-
166
-
167
-
168
-
169
-
170
-
171
-
172
-
173
-
174
-
175
-
176
-
177
-
178
-
179
-
180
-
181
-
182
-
183
-
184
-
185
-
186
-
187
-
188
-
189
-
190
-
191
-
192
-
193
-
194
-
195
-
196
-
197
-
198
-
199
-
200
-
201
-
202
-
203
-
204
-
205
-
206
-
207
-
208
-
209
-
210
-
211
-
212
-
213
-
214
-
215
-
216
-
217
-
218
-
219
-
220
-
221
-
222
-
223
-
224
-
225
-
226
-
227
-
228
-
229
-
230
-
231
-
232
-
233
-
234
-
235
-
236
-
237
-
238
-
239
-
240
-
241
-
242
-
243
-
244
-
245
-
246
-
247
-
248
-
249
-
250
-
251
-
252
-
253
-
254
-
255
-
256
-
257
-
258
-
259
-
260
-
261
-
262
-
263
-
264
-
265
-
266
-
267
-
268
-
269
-
270
-
271
-
272
-
273
-
274
-
275
-
276
-
277
-
278
-
279
-
280
-
281
-
282
-
283
-
284
-
285
-
286
-
287
-
288
-
289
-
290
-
291
-
292
-
293
-
294
-
295
-
296
-
297
-
298
 |
 |

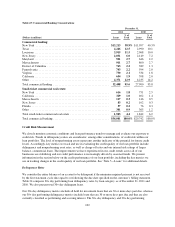
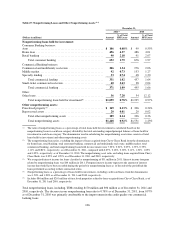
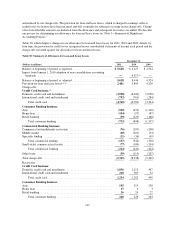
December 31,
(Dollars in millions) 2011 2010 2009
Commercial Banking business:
Commercial and multifamily real estate .............................. 12 20 2
Middle market .................................................. 14 24 3
Specialty lending ................................................ 683
Total commercial lending ..................................... 32 52 8
Small-ticket commercial real estate .................................. 522
Total commercial banking ..................................... 37 54 10
Other loans ..................................................... 582
Total recoveries ................................................. 1,544 1,587 774
Net charge-offs .................................................. (3,771) (6,651) (4,568)
Impact from acquisitions, sales and other changes ...................... (8)(4) (60)(5) (59)
Balance at end of period(3) ......................................... $ 4,250 $ 5,628 $ 4,127
Allowance for loan and lease losses as a percentage of loans held for
investment ................................................... 3.13% 4.47% 4.55%
December 31,
2011 2010 2009
Allowance for loan and lease losses by geographic distribution:
Domestic ....................................................... $ 3,778 $ 5,168 $ 3,928
International .................................................... 472 460 199
Total allowance for loan and lease losses ............................. $ 4,250 $ 5,628 $ 4,127
Allowance for loan and lease losses by loan category:
Domestic card ................................................... $ 2,375 $ 3,581 $ 1,927
International card ................................................ 472 460 199
Consumer banking ............................................... 652 675 1,076
Commercial banking ............................................. 711 826 785
Other .......................................................... 40 86 140
Allowance for loan and lease losses .................................. $ 4,250 $ 5,628 $ 4,127
(1) Includes an adjustment of $53 million made in the second quarter of 2010 for the impact as of January 1, 2010 of
impairment on consolidated loans accounted for as TDRs.
(2) Excludes a negative provision for unfunded lending commitments of $41 million and a provision for unfunded lending
commitments of $12 million for 2011 and 2010, respectively.
(3) The reduction in the provision for loan and lease losses attributable to Kohl’s was $257 million for 2011. Loss sharing
amounts attributable to Kohl’s reduced charge-offs by $118 million in 2011. The expected reimbursement from Kohl’s
netted in our allowance for loan and lease losses was approximately $139 million as of December 31, 2011.
(4) Includes foreign translation adjustment of $8 million for 2011.
(5) Includes a reduction in our allowance for loan and lease losses of $73 million during the first quarter of 2010 attributable
to the sale of certain interest-only option-ARM bonds and the deconsolidation of the related securitization trusts related
to Chevy Chase Bank in the first quarter of 2010.
112