Capital One 2011 Annual Report Download - page 58
Download and view the complete annual report
Please find page 58 of the 2011 Capital One annual report below. You can navigate through the pages in the report by either clicking on the pages listed below, or by using the keyword search tool below to find specific information within the annual report.-
 1
1 -
2
-
3
-
4
-
5
-
6
-
7
-
8
-
9
-
10
-
11
-
12
-
13
-
14
-
15
-
16
-
17
-
18
-
19
-
20
-
21
-
22
-
23
-
24
-
25
-
26
-
27
-
28
-
29
-
30
-
31
-
32
-
33
-
34
-
35
-
36
-
37
-
38
-
39
-
40
-
41
-
42
-
43
-
44
-
45
-
46
-
47
-
 48
48 -
 49
49 -
 50
50 -
 51
51 -
 52
52 -
 53
53 -
 54
54 -
 55
55 -
 56
56 -
 57
57 -
 58
58 -
 59
59 -
 60
60 -
 61
61 -
 62
62 -
 63
63 -
 64
64 -
 65
65 -
 66
66 -
 67
67 -
 68
68 -
69
-
70
-
71
-
72
-
73
-
74
-
75
-
76
-
77
-
78
-
79
-
80
-
81
-
82
-
83
-
84
-
85
-
86
-
87
-
88
-
89
-
90
-
91
-
92
-
93
-
94
-
95
-
96
-
97
-
98
-
99
-
100
-
101
-
102
-
103
-
104
-
105
-
106
-
107
-
108
-
109
-
110
-
111
-
112
-
113
-
114
-
115
-
116
-
117
-
118
-
119
-
120
-
121
-
122
-
123
-
124
-
125
-
126
-
127
-
128
-
129
-
130
-
131
-
132
-
133
-
134
-
135
-
136
-
137
-
138
-
139
-
140
-
141
-
142
-
143
-
144
-
145
-
146
-
147
-
148
-
149
-
150
-
151
-
152
-
153
-
154
-
155
-
156
-
157
-
158
-
159
-
160
-
161
-
162
-
163
-
164
-
165
-
166
-
167
-
168
-
169
-
170
-
171
-
172
-
173
-
174
-
175
-
176
-
177
-
178
-
179
-
180
-
181
-
182
-
183
-
184
-
185
-
186
-
187
-
188
-
189
-
190
-
191
-
192
-
193
-
194
-
195
-
196
-
197
-
198
-
199
-
200
-
201
-
202
-
203
-
204
-
205
-
206
-
207
-
208
-
209
-
210
-
211
-
212
-
213
-
214
-
215
-
216
-
217
-
218
-
219
-
220
-
221
-
222
-
223
-
224
-
225
-
226
-
227
-
228
-
229
-
230
-
231
-
232
-
233
-
234
-
235
-
236
-
237
-
238
-
239
-
240
-
241
-
242
-
243
-
244
-
245
-
246
-
247
-
248
-
249
-
250
-
251
-
252
-
253
-
254
-
255
-
256
-
257
-
258
-
259
-
260
-
261
-
262
-
263
-
264
-
265
-
266
-
267
-
268
-
269
-
270
-
271
-
272
-
273
-
274
-
275
-
276
-
277
-
278
-
279
-
280
-
281
-
282
-
283
-
284
-
285
-
286
-
287
-
288
-
289
-
290
-
291
-
292
-
293
-
294
-
295
-
296
-
297
-
298
 |
 |

Change
Year Ended December 31, 2011 vs. 2010 vs.
2011 2010 2009(1) 2008 2007 2010 2009
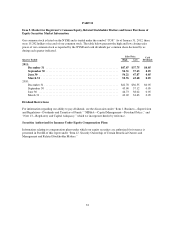
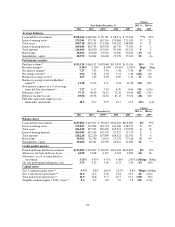
Average balances
Loans held for investment ............... $128,424 $128,526 $ 99,787 $ 98,971 $ 93,542 **% 29%
Interest-earning assets .................. 175,341 175,741 145,310 133,084 121,420 ** 21
Total assets .......................... 199,718 200,114 171,598 156,292 148,983 ** 17
Interest-bearing deposits ................ 109,644 104,743 103,078 82,736 73,765 52
Total deposits ........................ 126,694 119,010 115,601 93,508 85,212 63
Borrowings .......................... 38,022 49,620 23,522 31,096 30,102 (23) 111
Stockholders’ equity ................... 28,579 24,941 26,606 25,278 25,203 15 (6)
Performance metrics
Purchase volume(5) .................... $135,120 $106,912 $102,068 $113,835 $115,181 26% 5%
Revenue margin(6) ..................... 9.28% 9.20% 8.94% 10.44% 12.01% 8bps 26bps
Net interest margin(7) ................... 7.27 7.09 5.30 5.38 5.38 18 179
Net charge-off rate(8) ................... 2.94 5.18 4.58 3.51 2.10 (224) 60
Return on average assets(9) .............. 1.63 1.52 0.58 0.05 1.74 11 94
Return on average total stockholders’
equity(10) .......................... 11.38 12.23 3.71 0.34 10.28 (85) 852
Non-interest expense as a % of average
loans held for investment(11) ........... 7.27 6.17 7.43 8.30 8.64 110 (126)
Efficiency ratio(12) ..................... 57.33 49.06 56.21 52.29 54.44 827 (715)
Effective income tax rate ............... 29.08 29.56 26.16 85.47 33.02 (48) 340
Full-time equivalent employees (in
thousands), period end ............... 30.5 25.7 25.9 23.7 27.0 19% (1)%
Change
December 31, 2011 vs. 2010 vs.
2011 2010 2009(1) 2008 2007 2010 2009
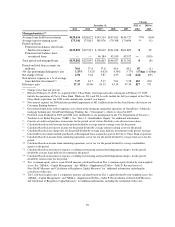
Balance sheet
Loans held for investment ............... $135,892 $125,947 $ 90,619 $101,018 $101,805 8% 39%
Interest-earning assets .................. 179,817 172,024 139,724 141,386 128,725 523
Total assets .......................... 206,019 197,503 169,646 165,913 150,590 416
Interest-bearing deposits ................ 109,945 107,162 102,370 97,327 71,715 35
Total deposits ........................ 128,226 122,210 115,809 108,621 82,761 56
Borrowings .......................... 39,561 41,796 21,014 23,178 37,526 (5) 99
Stockholders’ equity ................... 29,666 26,541 26,590 26,612 24,294 12 **
Credit quality metrics
Period-end loans held for investment ...... $135,892 $125,947 $ 90,619 $101,018 $101,805 8% 39%
Allowance for loan and lease losses ....... 4,250 5,628 4,127 4,524 2,963 (24) 36
Allowance as a % of loans held for
investment ......................... 3.13% 4.47% 4.55% 4.48% 2.91% (134)bps (8)bps
30+ day performing delinquency rate ...... 3.35 3.52 3.98 4.21 3.50 (17) (46)
Capital ratios
Tier 1 common equity ratio(13) ........... 9.7% 8.8% 10.6% 12.5% 8.8% 90bps (180)bps
Tier 1 risk-based capital ratio(14) .......... 12.0 11.6 13.8 13.8 10.1 40 (220)
Total risk-based capital ratio(15) .......... 14.9 16.8 17.7 16.7 13.1 (190) (90)
Tangible common equity (“TCE”) ratio(16) .. 8.2 6.9 8.0 5.6 5.8 130 (110)
38