Capital One 2011 Annual Report Download - page 59
Download and view the complete annual report
Please find page 59 of the 2011 Capital One annual report below. You can navigate through the pages in the report by either clicking on the pages listed below, or by using the keyword search tool below to find specific information within the annual report.-
 1
1 -
2
-
3
-
4
-
5
-
6
-
7
-
8
-
9
-
10
-
11
-
12
-
13
-
14
-
15
-
16
-
17
-
18
-
19
-
20
-
21
-
22
-
23
-
24
-
25
-
26
-
27
-
28
-
29
-
30
-
31
-
32
-
33
-
34
-
35
-
36
-
37
-
38
-
39
-
40
-
41
-
42
-
43
-
44
-
45
-
46
-
47
-
48
-
 49
49 -
 50
50 -
 51
51 -
 52
52 -
 53
53 -
 54
54 -
 55
55 -
 56
56 -
 57
57 -
 58
58 -
 59
59 -
 60
60 -
 61
61 -
 62
62 -
 63
63 -
 64
64 -
 65
65 -
 66
66 -
 67
67 -
 68
68 -
 69
69 -
70
-
71
-
72
-
73
-
74
-
75
-
76
-
77
-
78
-
79
-
80
-
81
-
82
-
83
-
84
-
85
-
86
-
87
-
88
-
89
-
90
-
91
-
92
-
93
-
94
-
95
-
96
-
97
-
98
-
99
-
100
-
101
-
102
-
103
-
104
-
105
-
106
-
107
-
108
-
109
-
110
-
111
-
112
-
113
-
114
-
115
-
116
-
117
-
118
-
119
-
120
-
121
-
122
-
123
-
124
-
125
-
126
-
127
-
128
-
129
-
130
-
131
-
132
-
133
-
134
-
135
-
136
-
137
-
138
-
139
-
140
-
141
-
142
-
143
-
144
-
145
-
146
-
147
-
148
-
149
-
150
-
151
-
152
-
153
-
154
-
155
-
156
-
157
-
158
-
159
-
160
-
161
-
162
-
163
-
164
-
165
-
166
-
167
-
168
-
169
-
170
-
171
-
172
-
173
-
174
-
175
-
176
-
177
-
178
-
179
-
180
-
181
-
182
-
183
-
184
-
185
-
186
-
187
-
188
-
189
-
190
-
191
-
192
-
193
-
194
-
195
-
196
-
197
-
198
-
199
-
200
-
201
-
202
-
203
-
204
-
205
-
206
-
207
-
208
-
209
-
210
-
211
-
212
-
213
-
214
-
215
-
216
-
217
-
218
-
219
-
220
-
221
-
222
-
223
-
224
-
225
-
226
-
227
-
228
-
229
-
230
-
231
-
232
-
233
-
234
-
235
-
236
-
237
-
238
-
239
-
240
-
241
-
242
-
243
-
244
-
245
-
246
-
247
-
248
-
249
-
250
-
251
-
252
-
253
-
254
-
255
-
256
-
257
-
258
-
259
-
260
-
261
-
262
-
263
-
264
-
265
-
266
-
267
-
268
-
269
-
270
-
271
-
272
-
273
-
274
-
275
-
276
-
277
-
278
-
279
-
280
-
281
-
282
-
283
-
284
-
285
-
286
-
287
-
288
-
289
-
290
-
291
-
292
-
293
-
294
-
295
-
296
-
297
-
298
 |
 |

Change
December 31, 2011 vs. 2010 vs.
2011 2010 2009(1) 2008 2007 2010 2009
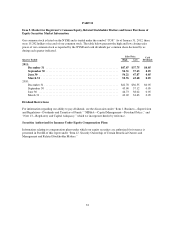
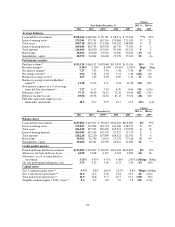
Managed metrics(17)
Average loans held for investment .... $128,424 $128,622 $143,514 $147,812 $144,727 **% (10)%
Average interest-earning assets ....... 175,341 175,815 185,976 179,348 170,496 ** (5)
Period-end loans:
Period-end on-balance sheet loans
held for investment ............ $135,892 $125,947 $ 90,619 $101,018 $101,805 839
Period-end off-balance sheet
securitized loans ............... — — 46,184 45,919 49,557 —(100)
Total period-end managed loans ...... $135,892 $125,947 $136,803 $146,937 $151,362 8(8)
Period-end total loan accounts (in
millions) ....................... 70.0 37.4 37.8 45.4 49.1 87 (1)
30+ day performing delinquency rate . . 3.35% 3.52% 4.62% 4.38% 3.77% (17)bps (110)bps
Net charge-off rate ................. 2.94 5.18 5.87 4.35 2.88 (224) (69)
Non-interest expense as a % of average
loans held for investment(11) ........ 7.27 6.17 5.17 5.01 5.58 110 100
Efficiency ratio ................... 57.33 49.06 43.35 43.14 47.30 827 571
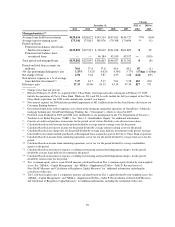
** Change is less than one percent.
(1) Effective February 27, 2009, we acquired Chevy Chase Bank. Our financial results subsequent to February 27, 2009
include the operations of Chevy Chase Bank. While our 2011 and 2010 results include the full year impact of the Chevy
Chase Bank acquisition, our 2009 results include only a partial year impact.
(2) Non-interest expense for 2008 includes goodwill impairment of $811 million related to the Auto Finance division of our
Consumer Banking business.
(3) Discontinued operations reflect ongoing costs related to the mortgage origination operations of GreenPoint’s wholesale
mortgage banking unit, GreenPoint Mortgage Funding, Inc. (“Greenpoint”), which we closed in 2007.
(4) Preferred stock dividends in 2009 and 2008 were attributable to our participation in the U.S. Department of Treasury’s
Troubled Asset Relief Program (“TARP”). See “Note 12—Stockholders’ Equity” for additional information.
(5) Consists of credit card purchase transactions for the period, net of returns. Excludes cash advance transactions.
(6) Calculated based on total revenue for the period divided by average interest-earning assets for the period.
(7) Calculated based on net interest income for the period divided by average interest-earning assets for the period.
(8) Calculated based on net charge-offs for the period divided by average loans held for investment for the period. Average
loans held for investment include purchased credit-impaired loans acquired as part of the Chevy Chase Bank acquisition
(9) Calculated based on income from continuing operations, net of tax, for the period divided by average total assets for the
period.
(10) Calculated based on income from continuing operations, net of tax, for the period divided by average stockholders’
equity for the period.
(11) Calculated based on non-interest expense, excluding restructuring and goodwill impairment charges, for the period
divided by average loans held for investment for the period.
(12) Calculated based on non-interest expense, excluding restructuring and goodwill impairment charges, for the period
divided by total revenue for the period.
(13) Tier 1 common equity ratio is a non-GAAP measure calculated based on Tier 1 common equity divided by risk-weighted
assets. See “MD&A—Capital Management” and “MD&A—Supplemental Tables—Table F: Reconciliation of
Non-GAAP Measures and Calculation of Regulatory Capital Measures” for `additional information, including the
calculation of this ratio.
(14)
Tier 1 risk-based capital ratio is a regulatory measure calculated based on Tier 1 capital divided by risk-weighted assets. See
“MD&A—Capital Management” and “MD&A—Supplemental Tables—Table F: Reconciliation of Non-GAAP Measures
and Calculation of Regulatory Capital Measures” for additional information, including the calculation of this ratio.
39