Capital One 2011 Annual Report Download - page 135
Download and view the complete annual report
Please find page 135 of the 2011 Capital One annual report below. You can navigate through the pages in the report by either clicking on the pages listed below, or by using the keyword search tool below to find specific information within the annual report.-
 1
1 -
2
-
3
-
4
-
5
-
6
-
7
-
8
-
9
-
10
-
11
-
12
-
13
-
14
-
15
-
16
-
17
-
18
-
19
-
20
-
21
-
22
-
23
-
24
-
25
-
26
-
27
-
28
-
29
-
30
-
31
-
32
-
33
-
34
-
35
-
36
-
37
-
38
-
39
-
40
-
41
-
42
-
43
-
44
-
45
-
46
-
47
-
48
-
49
-
50
-
51
-
52
-
53
-
54
-
55
-
56
-
57
-
58
-
59
-
60
-
61
-
62
-
63
-
64
-
65
-
66
-
67
-
68
-
69
-
70
-
71
-
72
-
73
-
74
-
75
-
76
-
77
-
78
-
79
-
80
-
81
-
82
-
83
-
84
-
85
-
86
-
87
-
88
-
89
-
90
-
91
-
92
-
93
-
94
-
95
-
96
-
97
-
98
-
99
-
100
-
101
-
102
-
103
-
104
-
105
-
106
-
107
-
108
-
109
-
110
-
111
-
112
-
113
-
114
-
115
-
116
-
117
-
118
-
119
-
120
-
121
-
122
-
123
-
124
-
 125
125 -
 126
126 -
 127
127 -
 128
128 -
 129
129 -
 130
130 -
 131
131 -
 132
132 -
 133
133 -
 134
134 -
 135
135 -
 136
136 -
 137
137 -
 138
138 -
 139
139 -
 140
140 -
 141
141 -
 142
142 -
 143
143 -
 144
144 -
 145
145 -
146
-
147
-
148
-
149
-
150
-
151
-
152
-
153
-
154
-
155
-
156
-
157
-
158
-
159
-
160
-
161
-
162
-
163
-
164
-
165
-
166
-
167
-
168
-
169
-
170
-
171
-
172
-
173
-
174
-
175
-
176
-
177
-
178
-
179
-
180
-
181
-
182
-
183
-
184
-
185
-
186
-
187
-
188
-
189
-
190
-
191
-
192
-
193
-
194
-
195
-
196
-
197
-
198
-
199
-
200
-
201
-
202
-
203
-
204
-
205
-
206
-
207
-
208
-
209
-
210
-
211
-
212
-
213
-
214
-
215
-
216
-
217
-
218
-
219
-
220
-
221
-
222
-
223
-
224
-
225
-
226
-
227
-
228
-
229
-
230
-
231
-
232
-
233
-
234
-
235
-
236
-
237
-
238
-
239
-
240
-
241
-
242
-
243
-
244
-
245
-
246
-
247
-
248
-
249
-
250
-
251
-
252
-
253
-
254
-
255
-
256
-
257
-
258
-
259
-
260
-
261
-
262
-
263
-
264
-
265
-
266
-
267
-
268
-
269
-
270
-
271
-
272
-
273
-
274
-
275
-
276
-
277
-
278
-
279
-
280
-
281
-
282
-
283
-
284
-
285
-
286
-
287
-
288
-
289
-
290
-
291
-
292
-
293
-
294
-
295
-
296
-
297
-
298
 |
 |

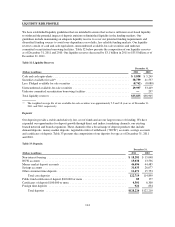
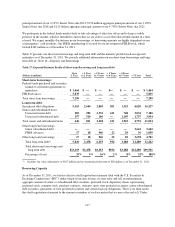
Total deposits increased by $6.0 billion, or 5%, in 2011 to $128.2 billion as of December 31, 2011. Of our total
deposits, approximately $921 million and $834 million were held in foreign banking offices as of December 31,
2011 and 2010, respectively. Large domestic denomination certificates of deposits of $100,000 or more
represented $4.6 billion and $6.5 billion of our total deposits as of December 31, 2011 and 2010, respectively.
We have brokered deposits, which we obtained through the use of third-party intermediaries. Brokered deposits
are included in money market deposit accounts and other consumer time deposits in Table 33 above. The Federal
Deposit Insurance Corporation Improvement Act of 1991 limits the use of brokered deposits to “well-
capitalized” insured depository institutions and, with a waiver from the Federal Deposit Insurance Corporation,
to “adequately capitalized” institutions. COBNA and CONA were “well-capitalized,” as defined under the
federal banking regulatory guidelines, as of December 31, 2011, and therefore permitted to maintain brokered
deposits. Our brokered deposits totaled $13.0 billion, or 10% of total deposits, as of December 31, 2011.
Brokered deposits totaled $16.5 billion, or 14% of total deposits, as of December 31, 2010. Based on our
historical access to the brokered deposit market, we expect to replace maturing brokered deposits with new
brokered deposits or direct deposits and branch deposits.
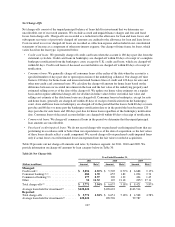
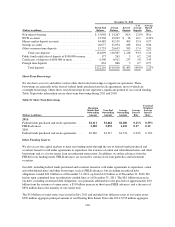
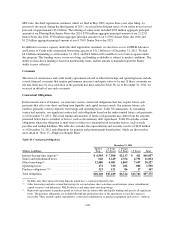
Table 34 presents the future contractual maturities of large denomination time deposits. Our funding and liquidity
planning factors into the maturities of these deposits. Based on past activity, we expect to retain a portion of
these deposits as they mature. Accordingly, the expected net cash outflows will be less than the amounts reported
based on the contractual maturities.
Table 34: Maturities of Large Domestic Denomination Certificates—$100,000 or More
December 31,
2011 2010
(Dollars in millions) Amount Percent Amount Percent
Three months or less ............................................ $ 496 10.8% $ 707 10.9%
Over 3 through 6 months ......................................... 460 10.0 650 10.0
Over 6 through 12 months ........................................ 643 14.0 1,612 24.9
Over 12 months through 10 years .................................. 2,987 65.2 3,508 54.2
Total ......................................................... $4,586 100.0% $6,477 100.0%
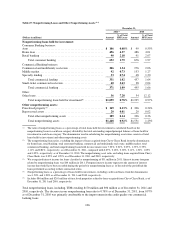
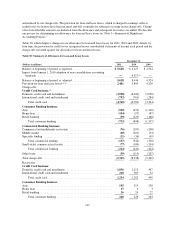
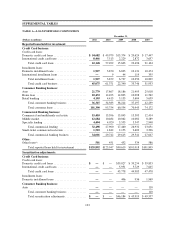
Table 35 provides a summary of the composition of period end, average deposits, interest expense and the
average deposit rate paid for the periods presented.
Table 35: Deposit Composition and Average Deposit Rates
December 31, 2011
(Dollars in millions)
Period End
Balance
Average
Balance
Interest
Expense
% of
Average
Deposits
Average
Deposit
Rate
Non-interest bearing ................................ $ 18,281 $ 17,051 N/A 13.5% N/A
NOW accounts .................................... 15,038 13,285 $ 41 10.5 0.31%
Money market deposit accounts ....................... 46,496 46,455 396 36.6 0.85
Savings accounts .................................. 31,433 29,640 218 23.4 0.74
Other consumer time deposits ........................ 11,471 13,855 351 10.9 2.53
Total core deposits ............................. 122,719 120,286 1,006 94.9 0.84
Public fund certificates of deposit of $100,000 or more .... 85 108 2 0.1 1.85
Certificates of deposit of $100,000 or more .............. 4,501 5,526 175 4.4 3.17
Foreign time deposits ............................... 921 774 4 0.6 0.52
Total deposits ................................. $128,226 $126,694 $1,187 100.0% 0.94%
115