Capital One 2011 Annual Report Download - page 249
Download and view the complete annual report
Please find page 249 of the 2011 Capital One annual report below. You can navigate through the pages in the report by either clicking on the pages listed below, or by using the keyword search tool below to find specific information within the annual report.-
 1
1 -
2
-
3
-
4
-
5
-
6
-
7
-
8
-
9
-
10
-
11
-
12
-
13
-
14
-
15
-
16
-
17
-
18
-
19
-
20
-
21
-
22
-
23
-
24
-
25
-
26
-
27
-
28
-
29
-
30
-
31
-
32
-
33
-
34
-
35
-
36
-
37
-
38
-
39
-
40
-
41
-
42
-
43
-
44
-
45
-
46
-
47
-
48
-
49
-
50
-
51
-
52
-
53
-
54
-
55
-
56
-
57
-
58
-
59
-
60
-
61
-
62
-
63
-
64
-
65
-
66
-
67
-
68
-
69
-
70
-
71
-
72
-
73
-
74
-
75
-
76
-
77
-
78
-
79
-
80
-
81
-
82
-
83
-
84
-
85
-
86
-
87
-
88
-
89
-
90
-
91
-
92
-
93
-
94
-
95
-
96
-
97
-
98
-
99
-
100
-
101
-
102
-
103
-
104
-
105
-
106
-
107
-
108
-
109
-
110
-
111
-
112
-
113
-
114
-
115
-
116
-
117
-
118
-
119
-
120
-
121
-
122
-
123
-
124
-
125
-
126
-
127
-
128
-
129
-
130
-
131
-
132
-
133
-
134
-
135
-
136
-
137
-
138
-
139
-
140
-
141
-
142
-
143
-
144
-
145
-
146
-
147
-
148
-
149
-
150
-
151
-
152
-
153
-
154
-
155
-
156
-
157
-
158
-
159
-
160
-
161
-
162
-
163
-
164
-
165
-
166
-
167
-
168
-
169
-
170
-
171
-
172
-
173
-
174
-
175
-
176
-
177
-
178
-
179
-
180
-
181
-
182
-
183
-
184
-
185
-
186
-
187
-
188
-
189
-
190
-
191
-
192
-
193
-
194
-
195
-
196
-
197
-
198
-
199
-
200
-
201
-
202
-
203
-
204
-
205
-
206
-
207
-
208
-
209
-
210
-
211
-
212
-
213
-
214
-
215
-
216
-
217
-
218
-
219
-
220
-
221
-
222
-
223
-
224
-
225
-
226
-
227
-
228
-
229
-
230
-
231
-
232
-
233
-
234
-
235
-
236
-
237
-
238
-
 239
239 -
 240
240 -
 241
241 -
 242
242 -
 243
243 -
 244
244 -
 245
245 -
 246
246 -
 247
247 -
 248
248 -
 249
249 -
 250
250 -
 251
251 -
 252
252 -
 253
253 -
 254
254 -
 255
255 -
 256
256 -
 257
257 -
 258
258 -
 259
259 -
260
-
261
-
262
-
263
-
264
-
265
-
266
-
267
-
268
-
269
-
270
-
271
-
272
-
273
-
274
-
275
-
276
-
277
-
278
-
279
-
280
-
281
-
282
-
283
-
284
-
285
-
286
-
287
-
288
-
289
-
290
-
291
-
292
-
293
-
294
-
295
-
296
-
297
-
298
 |
 |

CAPITAL ONE FINANCIAL CORPORATION
NOTES TO CONSOLIDATED STATEMENTS—(Continued)
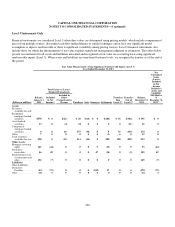
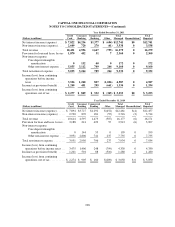
Fair Value Measurements Using Significant Unobservable Inputs (Level 3)
Year Ended December 31, 2010
Total Gains or (Losses)
(Realized/Unrealized) Purchases,
Sales,
Issuances,
and
Settlements,
Net
Net Unrealized
Gains (Losses)
Included in Net
Loss Related to
Assets and
Liabilities Still
Held as of
December 31,
2010(3)
(Dollars in millions)
Balance,
January 1,
2010
Impact of
New
Accounting
Standards
Included
in Net
Income(1)
Included in
Other
Comprehensive
(Loss) Income
Transfers
into
Level 3(2)
Transfers
Out of
Level 3(2)
Balance,
December 31,
2010
Assets:
Securities
available-for-sale:
Residential
mortgage-backed
securities ...... $1,468 $ 0 $ (3) $(92) $(30) $ 1,156 $(1,921) $578 $ (3)
Asset-backed
securities . . . . . . 13 0 0 (2) 70 50 (118) 13 0
Other ........... 25 0 0 0 0 0 (18) 7 0
Total securities
available-for-sale 1,506 0 (3) (94) 40 1,206 (2,057) 598 (3)
Other Assets: ....
Mortgage servicing
rights ......... 240 (17) (82) 0 0 0 0 141 (82)
Derivative
receivables ..... 440 (401) 5 0 4 0 (2) 46 5
Retained interest in
securitization and
other .......... 3,991 (86) (2) 0 0 (3,751) 0 152 0
Liabilities:
Other Liabilities . . .
Derivative
Payables ....... (33) 0 (11) 0 (1) 2 0 (43) (11)
Other ........... (18) 0 0 0 0 0 0 (18) 0
(1) Gains (losses) related to Level 3 mortgage servicing rights are reported in other non-interest income, which is a
component of non-interest income. Gains (losses) related to Level 3 derivative receivables and derivative payables are
reported in other non-interest income, which is a component of non-interest income. Gains (losses) related to Level 3
retained interests in securitizations are reported in servicing and securitizations income, which is a component of
non-interest income.
(2) The transfers out of Level 3 for the years ended December 31, 2011 and 2010 was primarily driven by greater
consistency amongst multiple pricing sources. The transfers into Level 3 was primarily driven by less consistency
amongst vendor pricing on individual securities for non-agency MBS.
(3) The amount presented for unrealized gains (loss) for assets still held as of the reporting date primarily represents
impairments for available-for-sale securities, accretion on certain fixed maturity securities, and change in fair value of
derivative instruments. The impairments are reported in total other-than-temporary losses as a component of non-interest
income.
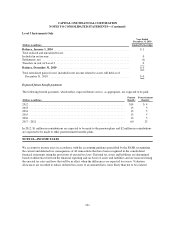
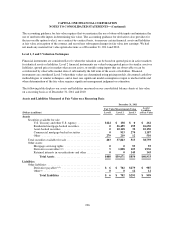
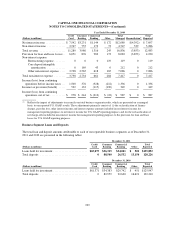
Assets and Liabilities Measured at Fair Value on a Nonrecurring Basis
We are required to measure and recognize certain other financial assets at fair value on a nonrecurring basis in
the consolidated balance sheet. These financial assets are not measured at fair value on an ongoing basis but are
subject to fair value adjustments in certain circumstances (for example, when we evaluate impairment).
229