Capital One 2011 Annual Report Download - page 145
Download and view the complete annual report
Please find page 145 of the 2011 Capital One annual report below. You can navigate through the pages in the report by either clicking on the pages listed below, or by using the keyword search tool below to find specific information within the annual report.-
 1
1 -
2
-
3
-
4
-
5
-
6
-
7
-
8
-
9
-
10
-
11
-
12
-
13
-
14
-
15
-
16
-
17
-
18
-
19
-
20
-
21
-
22
-
23
-
24
-
25
-
26
-
27
-
28
-
29
-
30
-
31
-
32
-
33
-
34
-
35
-
36
-
37
-
38
-
39
-
40
-
41
-
42
-
43
-
44
-
45
-
46
-
47
-
48
-
49
-
50
-
51
-
52
-
53
-
54
-
55
-
56
-
57
-
58
-
59
-
60
-
61
-
62
-
63
-
64
-
65
-
66
-
67
-
68
-
69
-
70
-
71
-
72
-
73
-
74
-
75
-
76
-
77
-
78
-
79
-
80
-
81
-
82
-
83
-
84
-
85
-
86
-
87
-
88
-
89
-
90
-
91
-
92
-
93
-
94
-
95
-
96
-
97
-
98
-
99
-
100
-
101
-
102
-
103
-
104
-
105
-
106
-
107
-
108
-
109
-
110
-
111
-
112
-
113
-
114
-
115
-
116
-
117
-
118
-
119
-
120
-
121
-
122
-
123
-
124
-
125
-
126
-
127
-
128
-
129
-
130
-
131
-
132
-
133
-
134
-
 135
135 -
 136
136 -
 137
137 -
 138
138 -
 139
139 -
 140
140 -
 141
141 -
 142
142 -
 143
143 -
 144
144 -
 145
145 -
 146
146 -
 147
147 -
 148
148 -
 149
149 -
 150
150 -
 151
151 -
 152
152 -
 153
153 -
 154
154 -
 155
155 -
156
-
157
-
158
-
159
-
160
-
161
-
162
-
163
-
164
-
165
-
166
-
167
-
168
-
169
-
170
-
171
-
172
-
173
-
174
-
175
-
176
-
177
-
178
-
179
-
180
-
181
-
182
-
183
-
184
-
185
-
186
-
187
-
188
-
189
-
190
-
191
-
192
-
193
-
194
-
195
-
196
-
197
-
198
-
199
-
200
-
201
-
202
-
203
-
204
-
205
-
206
-
207
-
208
-
209
-
210
-
211
-
212
-
213
-
214
-
215
-
216
-
217
-
218
-
219
-
220
-
221
-
222
-
223
-
224
-
225
-
226
-
227
-
228
-
229
-
230
-
231
-
232
-
233
-
234
-
235
-
236
-
237
-
238
-
239
-
240
-
241
-
242
-
243
-
244
-
245
-
246
-
247
-
248
-
249
-
250
-
251
-
252
-
253
-
254
-
255
-
256
-
257
-
258
-
259
-
260
-
261
-
262
-
263
-
264
-
265
-
266
-
267
-
268
-
269
-
270
-
271
-
272
-
273
-
274
-
275
-
276
-
277
-
278
-
279
-
280
-
281
-
282
-
283
-
284
-
285
-
286
-
287
-
288
-
289
-
290
-
291
-
292
-
293
-
294
-
295
-
296
-
297
-
298
 |
 |

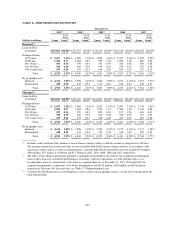
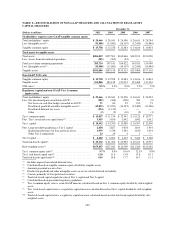
TABLE B—PERFORMING DELINQUENCIES
December 31,
2011(2) 2010(2) 2009(2) 2008 2007
(Dollars in millions) Loans
% of
Total
Loans(3) Loans
% of
Total
Loans(3) Loans
% of
Total
Loans(3) Loans
% of
Total
Loans(3) Loans
% of
Total
Loans(3)
Reported:(1)
Loans held for
investment ......... $135,892 100.00% $125,947 100.00% $ 90,619 100.00% $101,018 100.00% $101,805 100.00%
Delinquent loans:
30-59 days ......... $ 2,267 1.67% $ 1,968 1.56% $ 1,908 2.10% $ 2,325 2.30% $ 2,052 2.02%
60-89 days ......... 1,043 0.77 1,064 0.85 985 1.09 1,094 1.08 869 0.86
90-119 days ........ 497 0.36 559 0.44 356 0.39 410 0.41 290 0.28
120-149 days ....... 390 0.29 446 0.36 190 0.21 230 0.23 195 0.19
150 or more days .... 355 0.26 393 0.31 164 0.18 194 0.19 155 0.15
Total ........ $ 4,552 3.35% $ 4,430 3.52% $ 3,603 3.98% $ 4,253 4.21% $ 3,561 3.50%
By geographic area:
Domestic ........... $ 4,114 3.03% $ 3,998 3.18% $ 3,460 3.82% $ 4,107 4.07% $ 3,433 3.37%
International ........ 438 0.32 432 0.34 143 0.16 146 0.14 128 0.13
Total ........ $ 4,552 3.35% $ 4,430 3.52% $ 3,603 3.98% $ 4,253 4.21% $ 3,561 3.50%
Managed:(1)
Loans held for
investment ......... $135,892 100.00% $125,947 100.00% $136,803 100.00% $146,937 100.00% $151,362 100.00%
Delinquent loans:
30-59 days ......... $ 2,267 1.67% $ 1,968 1.56% $ 2,623 1.92% $ 2,987 2.03% $ 2,738 1.81%
60-89 days ......... 1,043 0.77 1,064 0.84 1,576 1.15 1,582 1.08 1,343 0.89
90-119 days ........ 497 0.36 559 0.44 895 0.65 817 0.56 681 0.45
120-149 days ....... 390 0.29 446 0.35 660 0.48 569 0.39 513 0.34
150 or more days .... 355 0.26 393 0.31 568 0.42 476 0.32 429 0.28
Total ........ $ 4,552 3.35% $ 4,430 3.52% $ 6,322 4.62% $ 6,431 4.38% $ 5,704 3.77%
By geographic area:
Domestic ........... $ 4,114 3.03% $ 3,998 3.18% $ 5,783 4.23% $ 5,915 4.03% $ 5,112 3.38%
International ........ 438 0.32 432 0.34 539 0.39 516 0.35 592 0.39
Total ........ $ 4,552 3.35% $ 4,430 3.52% $ 6,322 4.62% $ 6,431 4.38% $ 5,704 3.77%
(1) Includes credit card loans that continue to accrue finance charges and fees until the account is charged-off at 180 days.
The amounts reported for credit card loans are net of uncollectible billed finance charges and fees. In accordance with
our finance charge and fee revenue recognition policy, amounts billed but not included in revenue totaled $372 million,
$950 million, $2.1 billion, $1.9 billion and $1.1 billion in 2011, 2010, 2009, 2008 and 2007, respectively.
(2) The Chevy Chase Bank acquired loan portfolio is included in loans held for investment, but excluded from delinquent
loans as these loans are considered performing in accordance with our expectations as of the purchase date, as we
recorded these loans at estimated fair value when we acquired them. As of December 31, 2011, 2010 and 2009, the
acquired loan portfolio’s contractual 30 to 89 day delinquencies total $162 million, $199 million and $294 million,
respectively. For loans 90+ days past due, see Table C—Nonperforming Assets.
(3) Calculated by dividing loans in each delinquency status category and geographic region as of the end of the period by the
total loan portfolio.
125