Capital One 2011 Annual Report Download - page 81
Download and view the complete annual report
Please find page 81 of the 2011 Capital One annual report below. You can navigate through the pages in the report by either clicking on the pages listed below, or by using the keyword search tool below to find specific information within the annual report.-
 1
1 -
2
-
3
-
4
-
5
-
6
-
7
-
8
-
9
-
10
-
11
-
12
-
13
-
14
-
15
-
16
-
17
-
18
-
19
-
20
-
21
-
22
-
23
-
24
-
25
-
26
-
27
-
28
-
29
-
30
-
31
-
32
-
33
-
34
-
35
-
36
-
37
-
38
-
39
-
40
-
41
-
42
-
43
-
44
-
45
-
46
-
47
-
48
-
49
-
50
-
51
-
52
-
53
-
54
-
55
-
56
-
57
-
58
-
59
-
60
-
61
-
62
-
63
-
64
-
65
-
66
-
67
-
68
-
69
-
70
-
 71
71 -
 72
72 -
 73
73 -
 74
74 -
 75
75 -
 76
76 -
 77
77 -
 78
78 -
 79
79 -
 80
80 -
 81
81 -
 82
82 -
 83
83 -
 84
84 -
 85
85 -
 86
86 -
 87
87 -
 88
88 -
 89
89 -
 90
90 -
 91
91 -
92
-
93
-
94
-
95
-
96
-
97
-
98
-
99
-
100
-
101
-
102
-
103
-
104
-
105
-
106
-
107
-
108
-
109
-
110
-
111
-
112
-
113
-
114
-
115
-
116
-
117
-
118
-
119
-
120
-
121
-
122
-
123
-
124
-
125
-
126
-
127
-
128
-
129
-
130
-
131
-
132
-
133
-
134
-
135
-
136
-
137
-
138
-
139
-
140
-
141
-
142
-
143
-
144
-
145
-
146
-
147
-
148
-
149
-
150
-
151
-
152
-
153
-
154
-
155
-
156
-
157
-
158
-
159
-
160
-
161
-
162
-
163
-
164
-
165
-
166
-
167
-
168
-
169
-
170
-
171
-
172
-
173
-
174
-
175
-
176
-
177
-
178
-
179
-
180
-
181
-
182
-
183
-
184
-
185
-
186
-
187
-
188
-
189
-
190
-
191
-
192
-
193
-
194
-
195
-
196
-
197
-
198
-
199
-
200
-
201
-
202
-
203
-
204
-
205
-
206
-
207
-
208
-
209
-
210
-
211
-
212
-
213
-
214
-
215
-
216
-
217
-
218
-
219
-
220
-
221
-
222
-
223
-
224
-
225
-
226
-
227
-
228
-
229
-
230
-
231
-
232
-
233
-
234
-
235
-
236
-
237
-
238
-
239
-
240
-
241
-
242
-
243
-
244
-
245
-
246
-
247
-
248
-
249
-
250
-
251
-
252
-
253
-
254
-
255
-
256
-
257
-
258
-
259
-
260
-
261
-
262
-
263
-
264
-
265
-
266
-
267
-
268
-
269
-
270
-
271
-
272
-
273
-
274
-
275
-
276
-
277
-
278
-
279
-
280
-
281
-
282
-
283
-
284
-
285
-
286
-
287
-
288
-
289
-
290
-
291
-
292
-
293
-
294
-
295
-
296
-
297
-
298
 |
 |

for in hedge accounting relationships and gains and losses from the sale of investment securities, which we
generally do not allocate to our business segments because they relate to centralized asset/liability and market
risk management activities undertaken by our Corporate Treasury group.
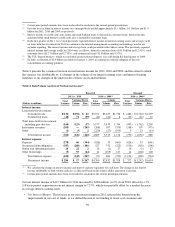
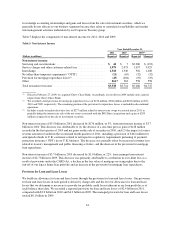
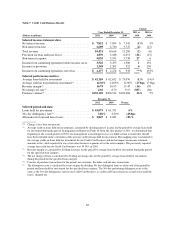
Table 5 displays the components of non-interest income for 2011, 2010 and 2009.
Table 5: Non-Interest Income
Year Ended December 31,
2011 2010 2009(1)
(Dollars in millions) Reported Reported Reported Managed
Non-interest income:
Servicing and securitizations .................................. $ 44 $ 7 $2,280 $ (193)
Service charges and other customer-related fees ................... 1,979 2,073 1,997 3,025
Interchange ................................................ 1,318 1,340 502 1,408
Net other-than-temporary impairment (“OTTI”) ................... (21) (65) (32) (32)
Provision for mortgage repurchase losses(2) ....................... (43) (204) (19) (19)
Other .................................................... 261(3) 563 558 558
Total non-interest income .................................... $3,538 $3,714 $5,286 $4,747
(1) Effective February 27, 2009, we acquired Chevy Chase Bank. Accordingly, our results for 2009 include only a partial
impact from Chevy Chase Bank.
(2) We recorded a total provision for mortgage repurchase losses of $212 million, $636 million and $181 million in 2011,
2010 and 2009, respectively. The remaining portion of the provision for repurchase losses is included in discontinued
operations.
(3) Includes a mark-to-market derivative loss of $277 million related to interest-rate swaps we entered into in 2011 to
partially hedge the interest rate risk of the net assets associated with the ING Direct acquisition and a gain of $259
million recognized on the sale of investment securities.
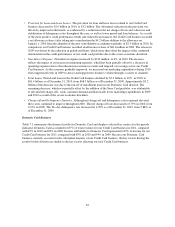
Non-interest income of $3.5 billion in 2011 decreased by $176 million, or 5%, from non-interest income of $3.7
billion in 2010. This decrease was attributable to (1) the absence of a one-time pre-tax gain of $128 million
recorded in the first quarter of 2010 and net gains on the sale of securities in 2010; and (2) the impact of contra-
revenue amounts recorded in the second and fourth quarters of 2011, including a provision of $102 million for
anticipated refunds to U.K. customers related to retrospective regulatory requirements pertaining to payment
protection insurance (“PPI”) in our U.K. business. The decrease was partially offset by increased customer fees
related to treasury management and public financing activities, and the decrease in the provision for mortgage
loan repurchases.
Non-interest income of $3.7 billion in 2010 decreased by $1.0 billion, or 22%, from managed non-interest
income of $4.7 billion in 2009. This decrease was primarily attributable to a reduction in over-limit fees as a
result of provisions under the CARD Act, a decline in the fair value of mortgage servicing rights due to the
run-off of our legacy home loan portfolio and an increase in the provision for mortgage loan repurchases.
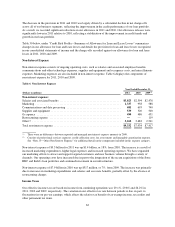
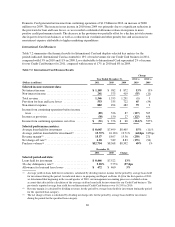
Provision for Loan and Lease Losses
We build our allowance for loan and lease losses through the provision for loan and lease losses. Our provision
for loan and lease losses in each period is driven by charge-offs and the level of allowance for loan and lease
losses that we determine is necessary to provide for probable credit losses inherent in our loan portfolio as of
each balance sheet date. We recorded a reported provision for loan and lease losses of $2.4 billion in 2011,
compared with $3.9 billion in 2010 and $4.2 billion in 2009. The managed provision for loan and lease losses
totaled $8.1 billion in 2009.
61