Capital One 2011 Annual Report Download - page 227
Download and view the complete annual report
Please find page 227 of the 2011 Capital One annual report below. You can navigate through the pages in the report by either clicking on the pages listed below, or by using the keyword search tool below to find specific information within the annual report.-
 1
1 -
2
-
3
-
4
-
5
-
6
-
7
-
8
-
9
-
10
-
11
-
12
-
13
-
14
-
15
-
16
-
17
-
18
-
19
-
20
-
21
-
22
-
23
-
24
-
25
-
26
-
27
-
28
-
29
-
30
-
31
-
32
-
33
-
34
-
35
-
36
-
37
-
38
-
39
-
40
-
41
-
42
-
43
-
44
-
45
-
46
-
47
-
48
-
49
-
50
-
51
-
52
-
53
-
54
-
55
-
56
-
57
-
58
-
59
-
60
-
61
-
62
-
63
-
64
-
65
-
66
-
67
-
68
-
69
-
70
-
71
-
72
-
73
-
74
-
75
-
76
-
77
-
78
-
79
-
80
-
81
-
82
-
83
-
84
-
85
-
86
-
87
-
88
-
89
-
90
-
91
-
92
-
93
-
94
-
95
-
96
-
97
-
98
-
99
-
100
-
101
-
102
-
103
-
104
-
105
-
106
-
107
-
108
-
109
-
110
-
111
-
112
-
113
-
114
-
115
-
116
-
117
-
118
-
119
-
120
-
121
-
122
-
123
-
124
-
125
-
126
-
127
-
128
-
129
-
130
-
131
-
132
-
133
-
134
-
135
-
136
-
137
-
138
-
139
-
140
-
141
-
142
-
143
-
144
-
145
-
146
-
147
-
148
-
149
-
150
-
151
-
152
-
153
-
154
-
155
-
156
-
157
-
158
-
159
-
160
-
161
-
162
-
163
-
164
-
165
-
166
-
167
-
168
-
169
-
170
-
171
-
172
-
173
-
174
-
175
-
176
-
177
-
178
-
179
-
180
-
181
-
182
-
183
-
184
-
185
-
186
-
187
-
188
-
189
-
190
-
191
-
192
-
193
-
194
-
195
-
196
-
197
-
198
-
199
-
200
-
201
-
202
-
203
-
204
-
205
-
206
-
207
-
208
-
209
-
210
-
211
-
212
-
213
-
214
-
215
-
216
-
 217
217 -
 218
218 -
 219
219 -
 220
220 -
 221
221 -
 222
222 -
 223
223 -
 224
224 -
 225
225 -
 226
226 -
 227
227 -
 228
228 -
 229
229 -
 230
230 -
 231
231 -
 232
232 -
 233
233 -
 234
234 -
 235
235 -
 236
236 -
 237
237 -
238
-
239
-
240
-
241
-
242
-
243
-
244
-
245
-
246
-
247
-
248
-
249
-
250
-
251
-
252
-
253
-
254
-
255
-
256
-
257
-
258
-
259
-
260
-
261
-
262
-
263
-
264
-
265
-
266
-
267
-
268
-
269
-
270
-
271
-
272
-
273
-
274
-
275
-
276
-
277
-
278
-
279
-
280
-
281
-
282
-
283
-
284
-
285
-
286
-
287
-
288
-
289
-
290
-
291
-
292
-
293
-
294
-
295
-
296
-
297
-
298
 |
 |

CAPITAL ONE FINANCIAL CORPORATION
NOTES TO CONSOLIDATED STATEMENTS—(Continued)
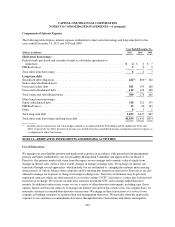
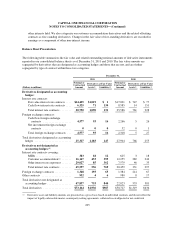
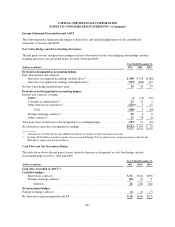
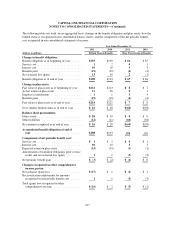
Income Statement Presentation and AOCI
The following tables summarize the impact of derivatives and related hedged items on our consolidated
statements of income and AOCI.
Fair Value Hedges and Free-Standing Derivatives
The net gains (losses) recognized in earnings related to derivatives in fair value hedging relationships and free-
standing derivatives are presented below for 2011, 2010 and 2009:
Year Ended December 31,
(Dollars in millions) 2011 2010 2009
Derivatives designated as accounting hedges:
Fair value interest rate contracts:
Gain (loss) recognized in earnings on derivatives(1) .......................... $ 348 $ 338 $(266)
Gain (loss) recognized in earnings on hedged items(1) ........................ (333) (288) 313
Net fair value hedge ineffectiveness gain ...................................... 15 50 47
Derivatives not designated as accounting hedges:
Interest rate contracts covering:
MSRs(1) ............................................................ 4(21) (27)
Customer accommodation(1) ............................................ 23 25 2
Other interest rate exposures(1) .......................................... (275)(2) 5 15
Total .......................................................... (248) 9 (10)
Foreign exchange contracts(1) ........................................... 30 40
Other contracts(1) ..................................................... 21 38 (9)
Total gain (loss) on derivatives not designated as accounting hedges ................ (197) 51 (19)
Net derivatives gain (loss) recognized in earnings ............................... $(182) $ 101 $ 28
(1) Amounts are recorded in our consolidated statements of income in other non-interest income.
(2) Includes $277 million in mark-to-market losses recorded during 2011 on interest-rate swap transactions related to the
ING Direct acquisition discussed above.
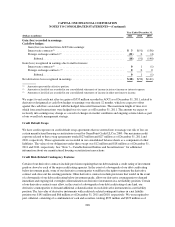
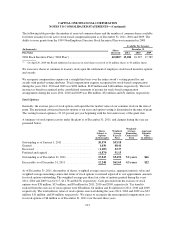
Cash Flow and Net Investment Hedges
The table below shows the net gains (losses) related to derivatives designated as cash flow hedges and net
investment hedges for 2011, 2010 and 2009:
Year Ended December 31,
(Dollars in millions) 2011 2010 2009
Gain (loss) recorded in AOCI:(1)
Cash flow hedges:
Interest rate contracts ................................................. $ 32 $(42) $(50)
Foreign exchange contracts ............................................ (20) (1) 4
Subtotal ........................................................ 12 (43) (46)
Net investment hedges:
Foreign exchange contracts ................................................ (2) (1) (7)
Net derivatives gain recognized in AOCI ..................................... $ 10 $(44) $(53)
207