Capital One 2011 Annual Report Download - page 275
Download and view the complete annual report
Please find page 275 of the 2011 Capital One annual report below. You can navigate through the pages in the report by either clicking on the pages listed below, or by using the keyword search tool below to find specific information within the annual report.-
 1
1 -
2
-
3
-
4
-
5
-
6
-
7
-
8
-
9
-
10
-
11
-
12
-
13
-
14
-
15
-
16
-
17
-
18
-
19
-
20
-
21
-
22
-
23
-
24
-
25
-
26
-
27
-
28
-
29
-
30
-
31
-
32
-
33
-
34
-
35
-
36
-
37
-
38
-
39
-
40
-
41
-
42
-
43
-
44
-
45
-
46
-
47
-
48
-
49
-
50
-
51
-
52
-
53
-
54
-
55
-
56
-
57
-
58
-
59
-
60
-
61
-
62
-
63
-
64
-
65
-
66
-
67
-
68
-
69
-
70
-
71
-
72
-
73
-
74
-
75
-
76
-
77
-
78
-
79
-
80
-
81
-
82
-
83
-
84
-
85
-
86
-
87
-
88
-
89
-
90
-
91
-
92
-
93
-
94
-
95
-
96
-
97
-
98
-
99
-
100
-
101
-
102
-
103
-
104
-
105
-
106
-
107
-
108
-
109
-
110
-
111
-
112
-
113
-
114
-
115
-
116
-
117
-
118
-
119
-
120
-
121
-
122
-
123
-
124
-
125
-
126
-
127
-
128
-
129
-
130
-
131
-
132
-
133
-
134
-
135
-
136
-
137
-
138
-
139
-
140
-
141
-
142
-
143
-
144
-
145
-
146
-
147
-
148
-
149
-
150
-
151
-
152
-
153
-
154
-
155
-
156
-
157
-
158
-
159
-
160
-
161
-
162
-
163
-
164
-
165
-
166
-
167
-
168
-
169
-
170
-
171
-
172
-
173
-
174
-
175
-
176
-
177
-
178
-
179
-
180
-
181
-
182
-
183
-
184
-
185
-
186
-
187
-
188
-
189
-
190
-
191
-
192
-
193
-
194
-
195
-
196
-
197
-
198
-
199
-
200
-
201
-
202
-
203
-
204
-
205
-
206
-
207
-
208
-
209
-
210
-
211
-
212
-
213
-
214
-
215
-
216
-
217
-
218
-
219
-
220
-
221
-
222
-
223
-
224
-
225
-
226
-
227
-
228
-
229
-
230
-
231
-
232
-
233
-
234
-
235
-
236
-
237
-
238
-
239
-
240
-
241
-
242
-
243
-
244
-
245
-
246
-
247
-
248
-
249
-
250
-
251
-
252
-
253
-
254
-
255
-
256
-
257
-
258
-
259
-
260
-
261
-
262
-
263
-
264
-
 265
265 -
 266
266 -
 267
267 -
 268
268 -
 269
269 -
 270
270 -
 271
271 -
 272
272 -
 273
273 -
 274
274 -
 275
275 -
 276
276 -
 277
277 -
 278
278 -
 279
279 -
 280
280 -
 281
281 -
 282
282 -
 283
283 -
 284
284 -
 285
285 -
286
-
287
-
288
-
289
-
290
-
291
-
292
-
293
-
294
-
295
-
296
-
297
-
298
 |
 |

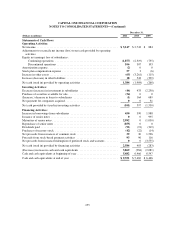
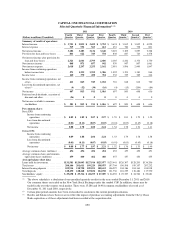
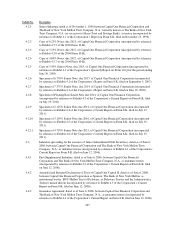
CAPITAL ONE FINANCIAL CORPORATION
NOTES TO CONSOLIDATED STATEMENTS—(Continued)
December 31,
(Dollars in millions) 2011 2010 2009
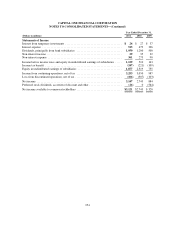
Statements of Cash Flows
Operating Activities:
Net income ......................................................... $ 3,147 $ 2,743 $ 884
Adjustments to reconcile net income (loss) to net cash provided by operating
activities:
Equity in (earnings) loss of subsidiaries:
Continuing operations ............................................ (1,877) (2,319) (735)
Discontinued operations ........................................... 106 307 103
Amortization expense ................................................. (2) 00
Stock plan compensation expense ....................................... 57 3 (6)
Increase in other assets ................................................ (65) (3,261) (115)
Increase (decrease) in other liabilities .................................... 18 543 (399)
Net cash (used in) provided by operating activities .......................... 1,384 (1,984) (268)
Investing Activities:
Decrease (increase) in investment in subsidiaries ........................... (46) 433 (2,250)
Purchase of securities available for sale ................................... (54) 00
(Increase ) decrease in loans to subsidiaries ............................... (1) 164 689
Net payment for companies acquired ..................................... 00 31
Net cash provided by (used in) investing activities .......................... (101) 597 (1,530)
Financing Activities:
Increase in borrowings from subsidiaries ................................. 450 390 1,988
Issuance of senior notes ............................................... 00 995
Maturities of senior notes .............................................. 2,992 0 (1,030)
Repurchase of senior notes ............................................. (855) 00
Dividends paid ...................................................... (91) (91) (319)
Purchases of treasury stock ............................................ (42) (22) (14)
Net proceeds from issuances of common stock ............................. 39 30 1,536
Proceeds from stock-based payment activities ............................. 93 96 116
Net proceeds from issuance/redemption of preferred stock and warrants ......... 00 (3,555)
Net cash (used in) provided by financing activities .......................... 2,586 403 (283)
(Decrease) increase in cash and cash equivalents ........................... 3,869 (984) (2,081)
Cash and cash equivalents at beginning of year ............................. 5,482 6,466 8,547
Cash and cash equivalents at end of year .................................. $ 9,351 $ 5,482 $ 6,466
255