Capital One 2011 Annual Report Download - page 84
Download and view the complete annual report
Please find page 84 of the 2011 Capital One annual report below. You can navigate through the pages in the report by either clicking on the pages listed below, or by using the keyword search tool below to find specific information within the annual report.U.S. GAAP. There is no comprehensive, authoritative body of guidance for management accounting equivalent
to U.S. GAAP; therefore, the managed basis presentation of our business segment results may not be comparable
to similar information provided by other financial service companies. In addition, our individual business
segment results should not be used as a substitute for comparable results determined in accordance with U.S.
GAAP. We provide additional information on our business segments, including the basis of presentation,
business segment reporting methodologies, and a reconciliation of our total business segment results to our
reported consolidated results in “Note 20—Business Segments.”
We summarize our business segment results for 2011, 2010 and 2009 in the tables below and provide a
comparative discussion of these results. We may periodically change our business segments or reclassify
business segment results based on modifications to our management reporting methodologies and changes in
organizational alignment. We provide information on the outlook for each of our business segments above under
“Executive Summary and Business Outlook.”
Credit Card Business
Our Credit Card business generated income of $2.3 billion in both 2011 and 2010 and income of $978 million in
2009. The primary sources of revenue for our Credit Card business are net interest income and non-interest
income from customer and interchange fees. Expenses primarily consist of ongoing operating costs, such as
salaries and associated benefits, communications and other technology expenses, supplies and equipment and
occupancy costs, as well as marketing expenses.
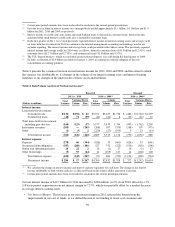
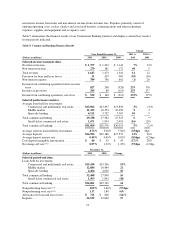
Table 7 summarizes the financial results of our Credit Card business, which is comprised of Domestic Card,
installment loans and International Card operations, and displays selected key metrics for the periods
indicated. Our Credit Card business results for 2011 reflect the impact of the acquisitions of the existing credit
card loan portfolios of Kohl’s and HBC. The results related to the Kohl’s loan portfolio, which totaled
approximately $3.7 billion at acquisition on April 1, 2011, are included in our Domestic Card business. The
results related to the HBC loan portfolio, which totaled approximately $1.4 billion at acquisition on January 7,
2011, are included in our International Card business.
Under the terms of the partnership agreement with Kohl’s, we share a fixed percentage of revenues, consisting of
finance charges and late fees, with Kohl’s, and Kohl’s is required to reimburse us for a fixed percentage of credit
losses incurred. Revenues and losses related to the Kohl’s credit card program are reported on a net basis in our
consolidated financial statements. The revenue sharing amounts earned by Kohl’s are reflected as an offset
against our revenues in our consolidated statements of income, which has the effect of reducing our net interest
income and revenue margins. The loss sharing amounts from Kohl’s are reflected as a reduction in our provision
for loan and lease losses in our consolidated statements of income. We also report the related allowance for loan
and lease losses attributable to the Kohl’s portfolio in our consolidated balance sheets net of the loss sharing
amount due from Kohl’s.
Interest income was reduced by $607 million in 2011 for amounts earned by Kohl’s. Loss sharing amounts
attributable to Kohl’s reduced charge-offs by $118 million in 2011. The expected reimbursement from Kohl’s,
which is netted against our allowance for loan and lease losses, totaled approximately $139 million as of
December 31, 2011. The reduction in the provision for loan and lease losses attributable to Kohl’s was $257
million for 2011.
We provide additional information on the acquisition of the existing credit card loan portfolios of Kohl’s and
HBC in “Note 2—Acquisitions and Restructuring Activities.”
64


