Capital One 2011 Annual Report Download - page 182
Download and view the complete annual report
Please find page 182 of the 2011 Capital One annual report below. You can navigate through the pages in the report by either clicking on the pages listed below, or by using the keyword search tool below to find specific information within the annual report.-
 1
1 -
2
-
3
-
4
-
5
-
6
-
7
-
8
-
9
-
10
-
11
-
12
-
13
-
14
-
15
-
16
-
17
-
18
-
19
-
20
-
21
-
22
-
23
-
24
-
25
-
26
-
27
-
28
-
29
-
30
-
31
-
32
-
33
-
34
-
35
-
36
-
37
-
38
-
39
-
40
-
41
-
42
-
43
-
44
-
45
-
46
-
47
-
48
-
49
-
50
-
51
-
52
-
53
-
54
-
55
-
56
-
57
-
58
-
59
-
60
-
61
-
62
-
63
-
64
-
65
-
66
-
67
-
68
-
69
-
70
-
71
-
72
-
73
-
74
-
75
-
76
-
77
-
78
-
79
-
80
-
81
-
82
-
83
-
84
-
85
-
86
-
87
-
88
-
89
-
90
-
91
-
92
-
93
-
94
-
95
-
96
-
97
-
98
-
99
-
100
-
101
-
102
-
103
-
104
-
105
-
106
-
107
-
108
-
109
-
110
-
111
-
112
-
113
-
114
-
115
-
116
-
117
-
118
-
119
-
120
-
121
-
122
-
123
-
124
-
125
-
126
-
127
-
128
-
129
-
130
-
131
-
132
-
133
-
134
-
135
-
136
-
137
-
138
-
139
-
140
-
141
-
142
-
143
-
144
-
145
-
146
-
147
-
148
-
149
-
150
-
151
-
152
-
153
-
154
-
155
-
156
-
157
-
158
-
159
-
160
-
161
-
162
-
163
-
164
-
165
-
166
-
167
-
168
-
169
-
170
-
171
-
 172
172 -
 173
173 -
 174
174 -
 175
175 -
 176
176 -
 177
177 -
 178
178 -
 179
179 -
 180
180 -
 181
181 -
 182
182 -
 183
183 -
 184
184 -
 185
185 -
 186
186 -
 187
187 -
 188
188 -
 189
189 -
 190
190 -
 191
191 -
 192
192 -
193
-
194
-
195
-
196
-
197
-
198
-
199
-
200
-
201
-
202
-
203
-
204
-
205
-
206
-
207
-
208
-
209
-
210
-
211
-
212
-
213
-
214
-
215
-
216
-
217
-
218
-
219
-
220
-
221
-
222
-
223
-
224
-
225
-
226
-
227
-
228
-
229
-
230
-
231
-
232
-
233
-
234
-
235
-
236
-
237
-
238
-
239
-
240
-
241
-
242
-
243
-
244
-
245
-
246
-
247
-
248
-
249
-
250
-
251
-
252
-
253
-
254
-
255
-
256
-
257
-
258
-
259
-
260
-
261
-
262
-
263
-
264
-
265
-
266
-
267
-
268
-
269
-
270
-
271
-
272
-
273
-
274
-
275
-
276
-
277
-
278
-
279
-
280
-
281
-
282
-
283
-
284
-
285
-
286
-
287
-
288
-
289
-
290
-
291
-
292
-
293
-
294
-
295
-
296
-
297
-
298
 |
 |
CAPITAL ONE FINANCIAL CORPORATION
NOTES TO CONSOLIDATED STATEMENTS—(Continued)
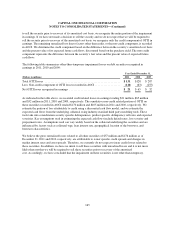
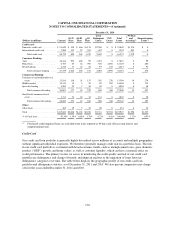
(1) Represents the amount of cumulative non-credit other-than-temporary impairment (“OTTI”) losses recorded in AOCI.
These losses are included in total gross unrealized losses.
(2) Represents the amount of cumulative gross unrealized losses on securities for which we have not recognized OTTI.
(3) Consists of debt securities issued by Fannie Mae and Freddie Mac, which had amortized cost of $130 million and $200
million, as of December 31, 2011 and 2010, respectively, and fair value of $137 million and $213 million, as of
December 31, 2011 and 2010, respectively.
(4) Consists of mortgage-backed securities issued by Fannie Mae, Freddie Mac and Ginnie Mae with amortized cost of
$12.3 billion, $8.9 billion and $4.5 billion, respectively, and fair value of $12.6 billion, $9.1 billion and $4.5 billion,
respectively, as of December 31, 2011. The book value of Fannie Mae, Freddie Mac and Ginnie Mae investments
exceeded 10% of our stockholders’ equity as of December 31, 2011.
(5) Consists of securities collateralized by credit card loans, auto loans, auto dealer floor plan inventory loans and leases,
student loans, equipment loans, and other. The distribution among these asset types was approximately 75% credit card
loans, 11% auto dealer floor plan inventory loans and leases, 6% auto loans, 4% student loans, 2% equipment loans, and
2% other as of December 31, 2011. In comparison, the distribution was approximately 78% credit card loans, 7% student
loans, 7% auto loans, 6% auto dealer floor plan inventory loans and leases, and 2% equipment loans as of December 31,
2010. Approximately 86% of the securities in our asset-backed security portfolio were rated AAA or its equivalent as of
December 31, 2011, compared with 90% as of December 31, 2010.
(6) Consists of municipal securities and equity investments, primarily related to CRA activities.
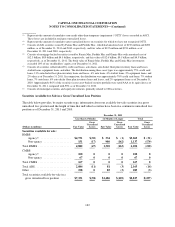
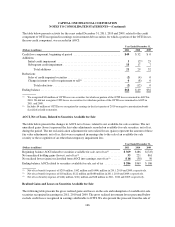
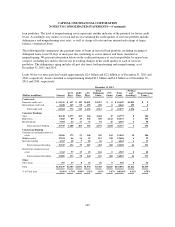
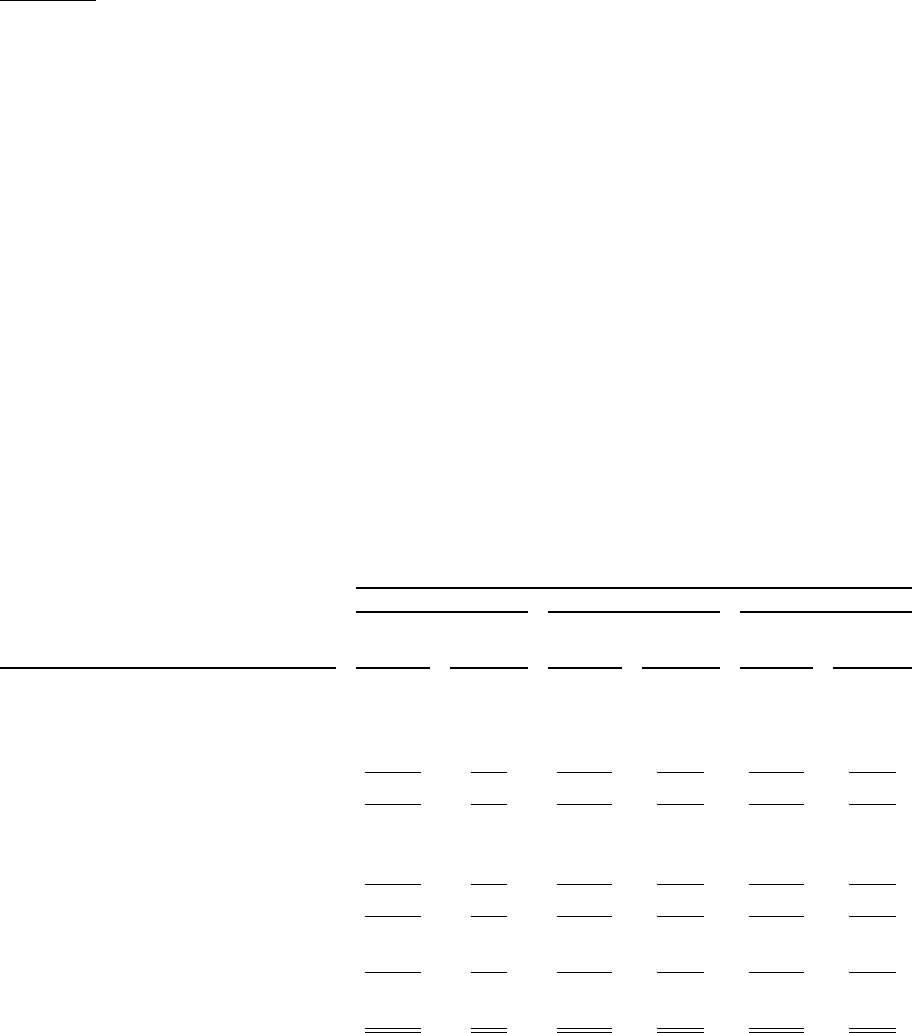
Securities Available for Sale in a Gross Unrealized Loss Position
The table below provides, by major security type, information about our available-for-sale securities in a gross
unrealized loss position and the length of time that individual securities have been in a continuous unrealized loss
position as of December 31, 2011 and 2010.
December 31, 2011
Less than 12 Months 12 Months or Longer Total
(Dollars in millions) Fair Value
Gross
Unrealized
Losses Fair Value
Gross
Unrealized
Losses Fair Value
Gross
Unrealized
Losses
Securities available for sale:
RMBS:
Agency(1) ..................... $4,731 $(30) $ 334 $ (1) $5,065 $ (31)
Non-agency ................... 151 (17) 986 (162) 1,137 (179)
Total RMBS ....................... 4,882 (47) 1,320 (163) 6,202 (210)
CMBS:
Agency(1) ..................... 100 0 0 0 100 0
Non-agency ................... 67 0 0 0 67 0
Total CMBS ....................... 167 0 0 0 167 0
Total ABS ......................... 2,084 (11) 81 (3) 2,165 (14)
Other ............................. 198 0 85 (3) 283 (3)
Total securities available-for-sale in a
gross unrealized loss position ....... $7,331 $(58) $1,486 $(169) $8,817 $(227)
162