Capital One 2011 Annual Report Download - page 185
Download and view the complete annual report
Please find page 185 of the 2011 Capital One annual report below. You can navigate through the pages in the report by either clicking on the pages listed below, or by using the keyword search tool below to find specific information within the annual report.-
 1
1 -
2
-
3
-
4
-
5
-
6
-
7
-
8
-
9
-
10
-
11
-
12
-
13
-
14
-
15
-
16
-
17
-
18
-
19
-
20
-
21
-
22
-
23
-
24
-
25
-
26
-
27
-
28
-
29
-
30
-
31
-
32
-
33
-
34
-
35
-
36
-
37
-
38
-
39
-
40
-
41
-
42
-
43
-
44
-
45
-
46
-
47
-
48
-
49
-
50
-
51
-
52
-
53
-
54
-
55
-
56
-
57
-
58
-
59
-
60
-
61
-
62
-
63
-
64
-
65
-
66
-
67
-
68
-
69
-
70
-
71
-
72
-
73
-
74
-
75
-
76
-
77
-
78
-
79
-
80
-
81
-
82
-
83
-
84
-
85
-
86
-
87
-
88
-
89
-
90
-
91
-
92
-
93
-
94
-
95
-
96
-
97
-
98
-
99
-
100
-
101
-
102
-
103
-
104
-
105
-
106
-
107
-
108
-
109
-
110
-
111
-
112
-
113
-
114
-
115
-
116
-
117
-
118
-
119
-
120
-
121
-
122
-
123
-
124
-
125
-
126
-
127
-
128
-
129
-
130
-
131
-
132
-
133
-
134
-
135
-
136
-
137
-
138
-
139
-
140
-
141
-
142
-
143
-
144
-
145
-
146
-
147
-
148
-
149
-
150
-
151
-
152
-
153
-
154
-
155
-
156
-
157
-
158
-
159
-
160
-
161
-
162
-
163
-
164
-
165
-
166
-
167
-
168
-
169
-
170
-
171
-
172
-
173
-
174
-
 175
175 -
 176
176 -
 177
177 -
 178
178 -
 179
179 -
 180
180 -
 181
181 -
 182
182 -
 183
183 -
 184
184 -
 185
185 -
 186
186 -
 187
187 -
 188
188 -
 189
189 -
 190
190 -
 191
191 -
 192
192 -
 193
193 -
 194
194 -
 195
195 -
196
-
197
-
198
-
199
-
200
-
201
-
202
-
203
-
204
-
205
-
206
-
207
-
208
-
209
-
210
-
211
-
212
-
213
-
214
-
215
-
216
-
217
-
218
-
219
-
220
-
221
-
222
-
223
-
224
-
225
-
226
-
227
-
228
-
229
-
230
-
231
-
232
-
233
-
234
-
235
-
236
-
237
-
238
-
239
-
240
-
241
-
242
-
243
-
244
-
245
-
246
-
247
-
248
-
249
-
250
-
251
-
252
-
253
-
254
-
255
-
256
-
257
-
258
-
259
-
260
-
261
-
262
-
263
-
264
-
265
-
266
-
267
-
268
-
269
-
270
-
271
-
272
-
273
-
274
-
275
-
276
-
277
-
278
-
279
-
280
-
281
-
282
-
283
-
284
-
285
-
286
-
287
-
288
-
289
-
290
-
291
-
292
-
293
-
294
-
295
-
296
-
297
-
298
 |
 |

CAPITAL ONE FINANCIAL CORPORATION
NOTES TO CONSOLIDATED STATEMENTS—(Continued)
to sell the security prior to recovery of its amortized cost basis, we recognize the entire portion of the impairment
in earnings. If we have not made a decision to sell the security and we do not expect that we will be required to
sell the security prior to recovery of the amortized cost basis, we recognize only the credit component of OTTI in
earnings. The remaining unrealized loss due to factors other than credit, or the non-credit component, is recorded
in AOCI. We determine the credit component based on the difference between the security’s amortized cost basis
and the present value of its expected future cash flows, discounted based on the purchase yield. The non-credit
component represents the difference between the security’s fair value and the present value of expected future
cash flows.
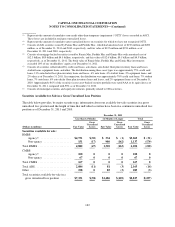
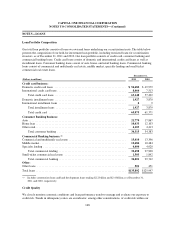
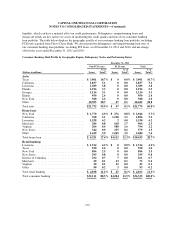
The following table summarizes other-than-temporary impairment losses on debt securities recognized in
earnings in 2011, 2010 and 2009:
Year Ended December 31,
(Dollars in millions) 2011 2010 2009
Total OTTI losses ..................................................... $ 131 $128 $ 287
Less: Non-credit component of OTTI losses recorded in AOCI .................. (110) (63) (255)
Net OTTI losses recognized in earnings .................................... $ 21 $ 65 $ 32
As indicated in the table above, we recorded credit related losses in earnings totaling $21 million, $65 million
and $32 million in 2011, 2010 and 2009, respectively. The cumulative non-credit related portion of OTTI on
these securities recorded in AOCI totaled $170 million and $105 million in 2011 and 2010, respectively. We
estimate the portion of loss attributable to credit using a discounted cash flow model, and we estimate the
expected cash flows from the underlying collateral using industry-standard third party modeling tools. These
tools take into consideration security specific delinquencies, product specific delinquency roll rates and expected
severities. Key assumptions used in estimating the expected cash flows include default rates, loss severity and
prepayment rates. Assumptions used can vary widely based on the collateral underlying the securities and are
influenced by factors such as collateral type, loan interest rate, geographical location of the borrower, and
borrower characteristics.
We believe the gross unrealized losses related to all other securities of $57 million and $176 million as of
December 31, 2011 and 2010, respectively, are attributable to issuer specific credit spreads and changes in
market interest rates and asset spreads. Therefore, we currently do not expect to incur credit losses related to
these securities. In addition, we have no intent to sell these securities with unrealized losses and it is not more
likely than not that we will be required to sell these securities prior to recovery of the amortized
cost. Accordingly, we have concluded that the impairment on these securities is not other-than-temporary.
165